FIGURE A5.

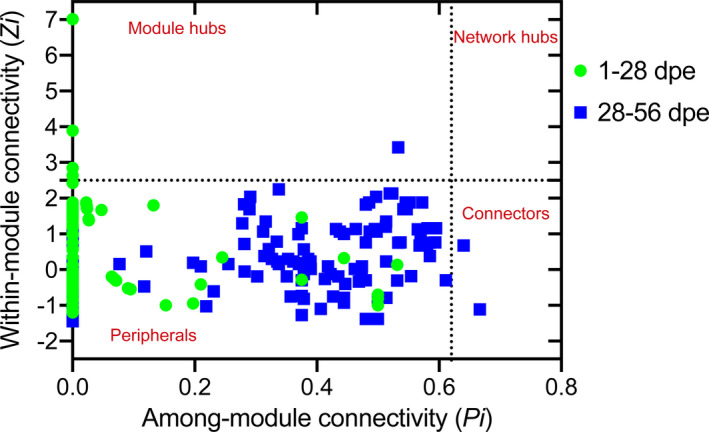
Z‐P plot illustrating the distribution of OTUs based on their topological roles. The horizontal dashed line represents Zi = 2.5, and the vertical dashed line represents Pi = 0.62

Z‐P plot illustrating the distribution of OTUs based on their topological roles. The horizontal dashed line represents Zi = 2.5, and the vertical dashed line represents Pi = 0.62