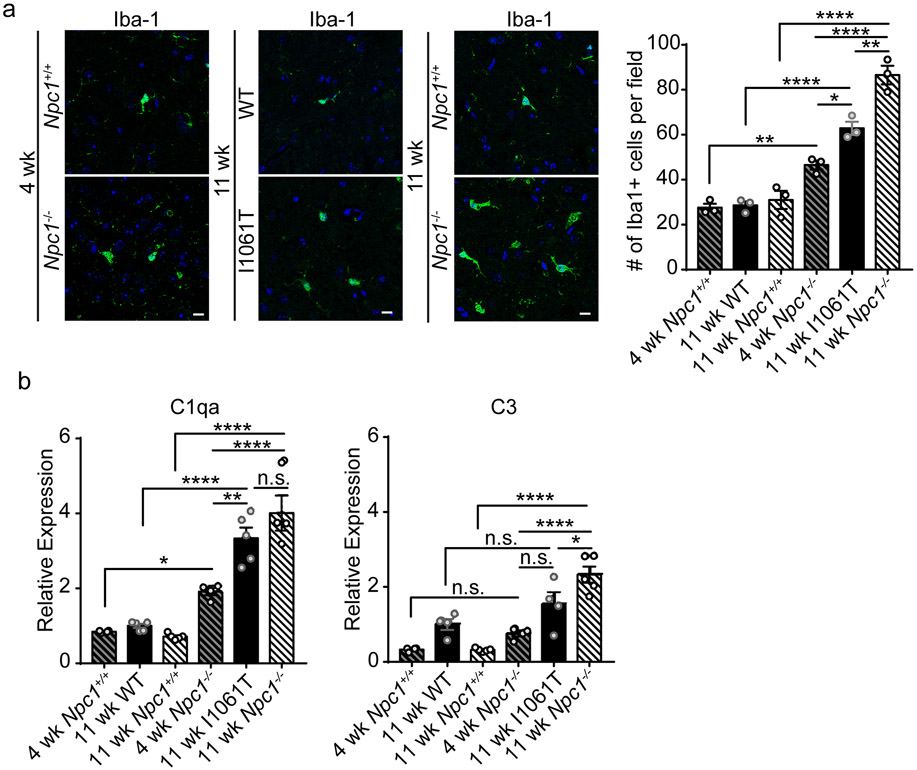
Figure 5. Microgliosis and complement activation in NPC mice.
(a) The brainstem from 4-week Npc1+/+ and Npc1−/− mice, 11-week WT and Npc1-I1061T mice, and 11-week Npc1+/+ and Npc1−/− mice was stained with Iba-1 and imaged by confocal microscopy. Scale bar: 10 μm. Right: Iba1+ cells per field, quantified from 4-5 fields, N=3 mice per genotype. (b) Relative expression of C1qa and C3 mRNA in brainstem by qPCR. N=4-5 mice per genotype. Data are shown as mean ± s.e.m. *P ≤ 0.05, **P ≤ 0.01, ****P ≤ 0.0001 by (a-b) one-way ANOVA with Tukey’s multiple comparisons (a) F=64.48; (b) F=40.57 (C1qa) and F=22.51 (C3)

