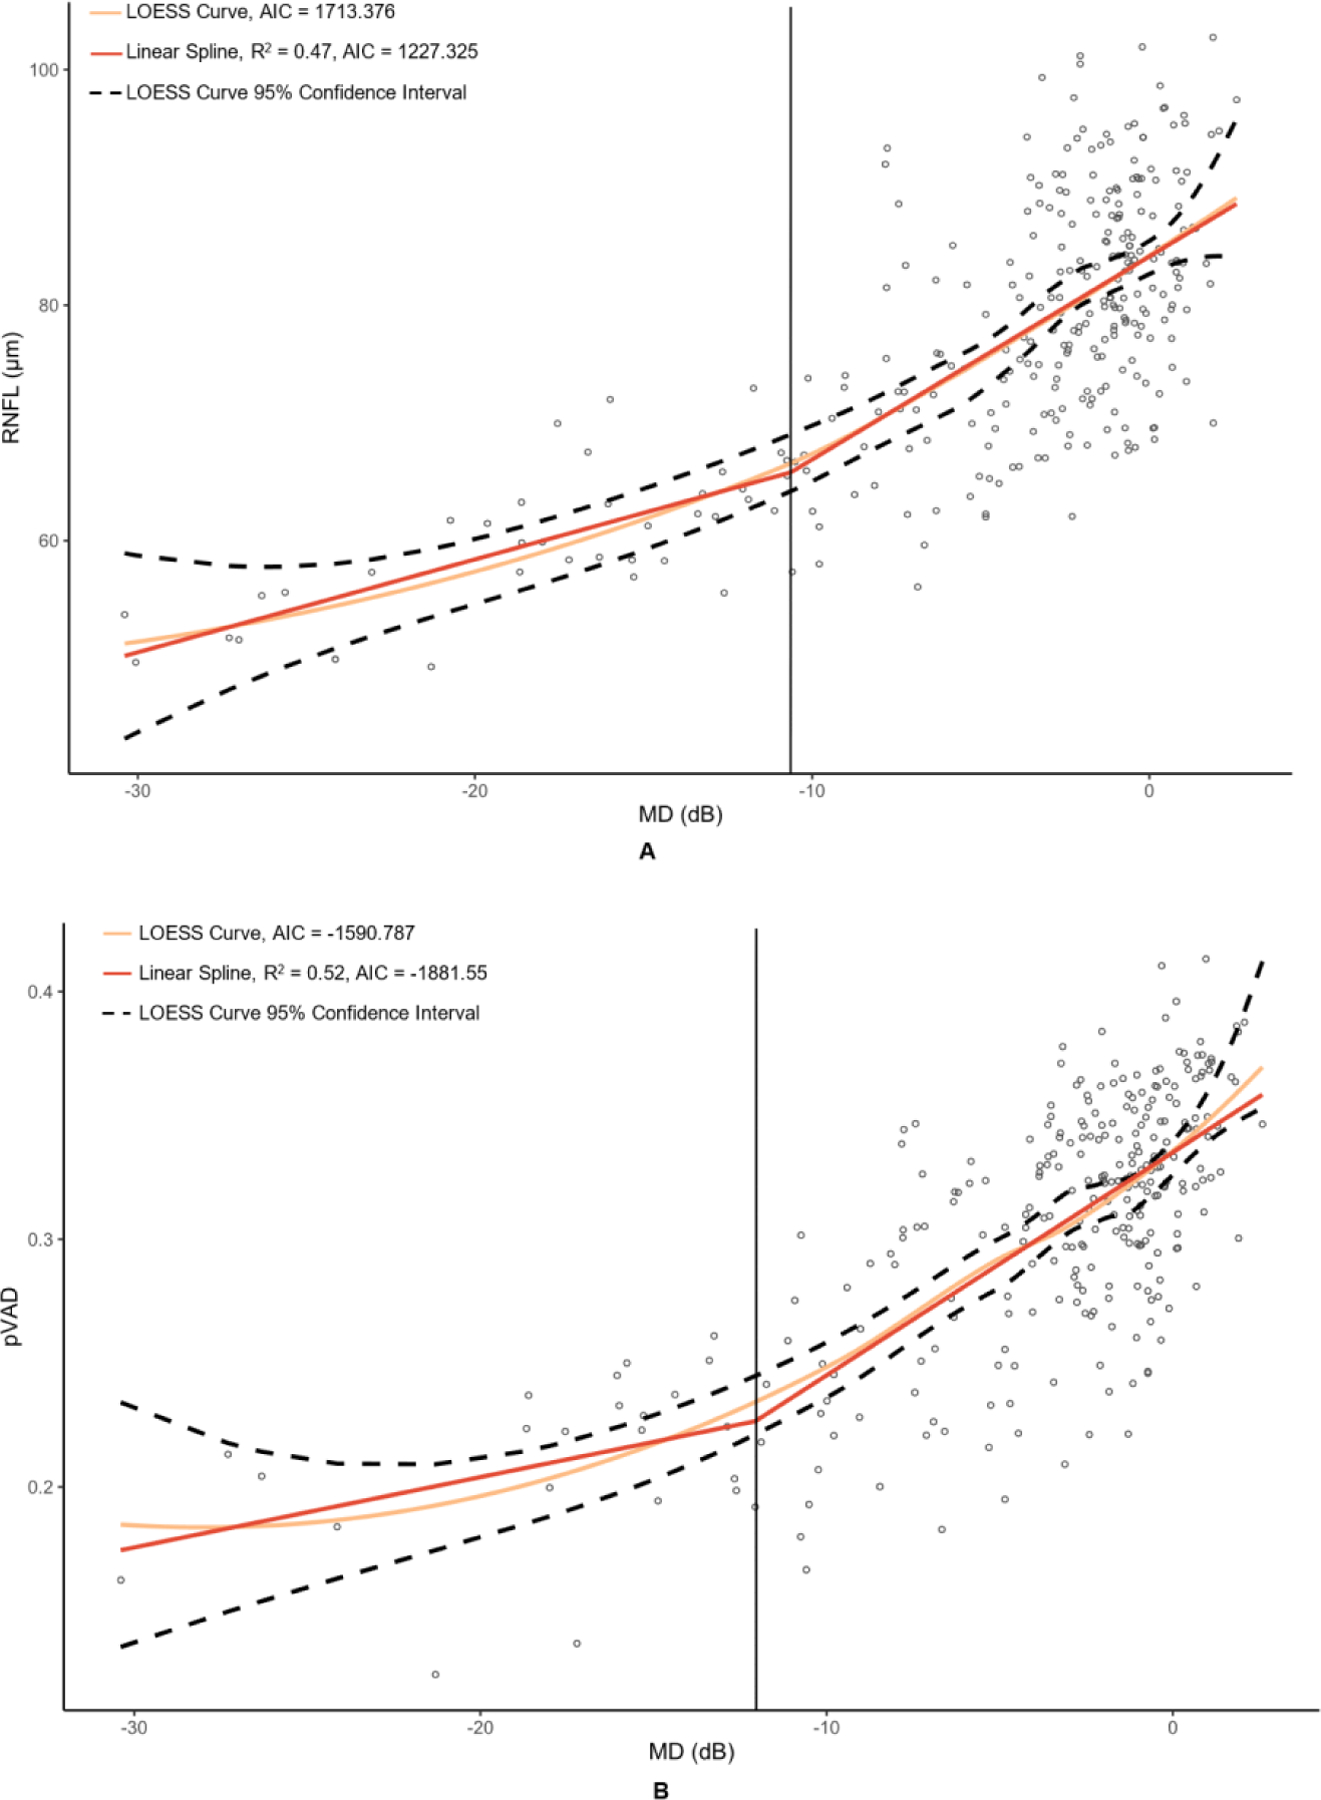
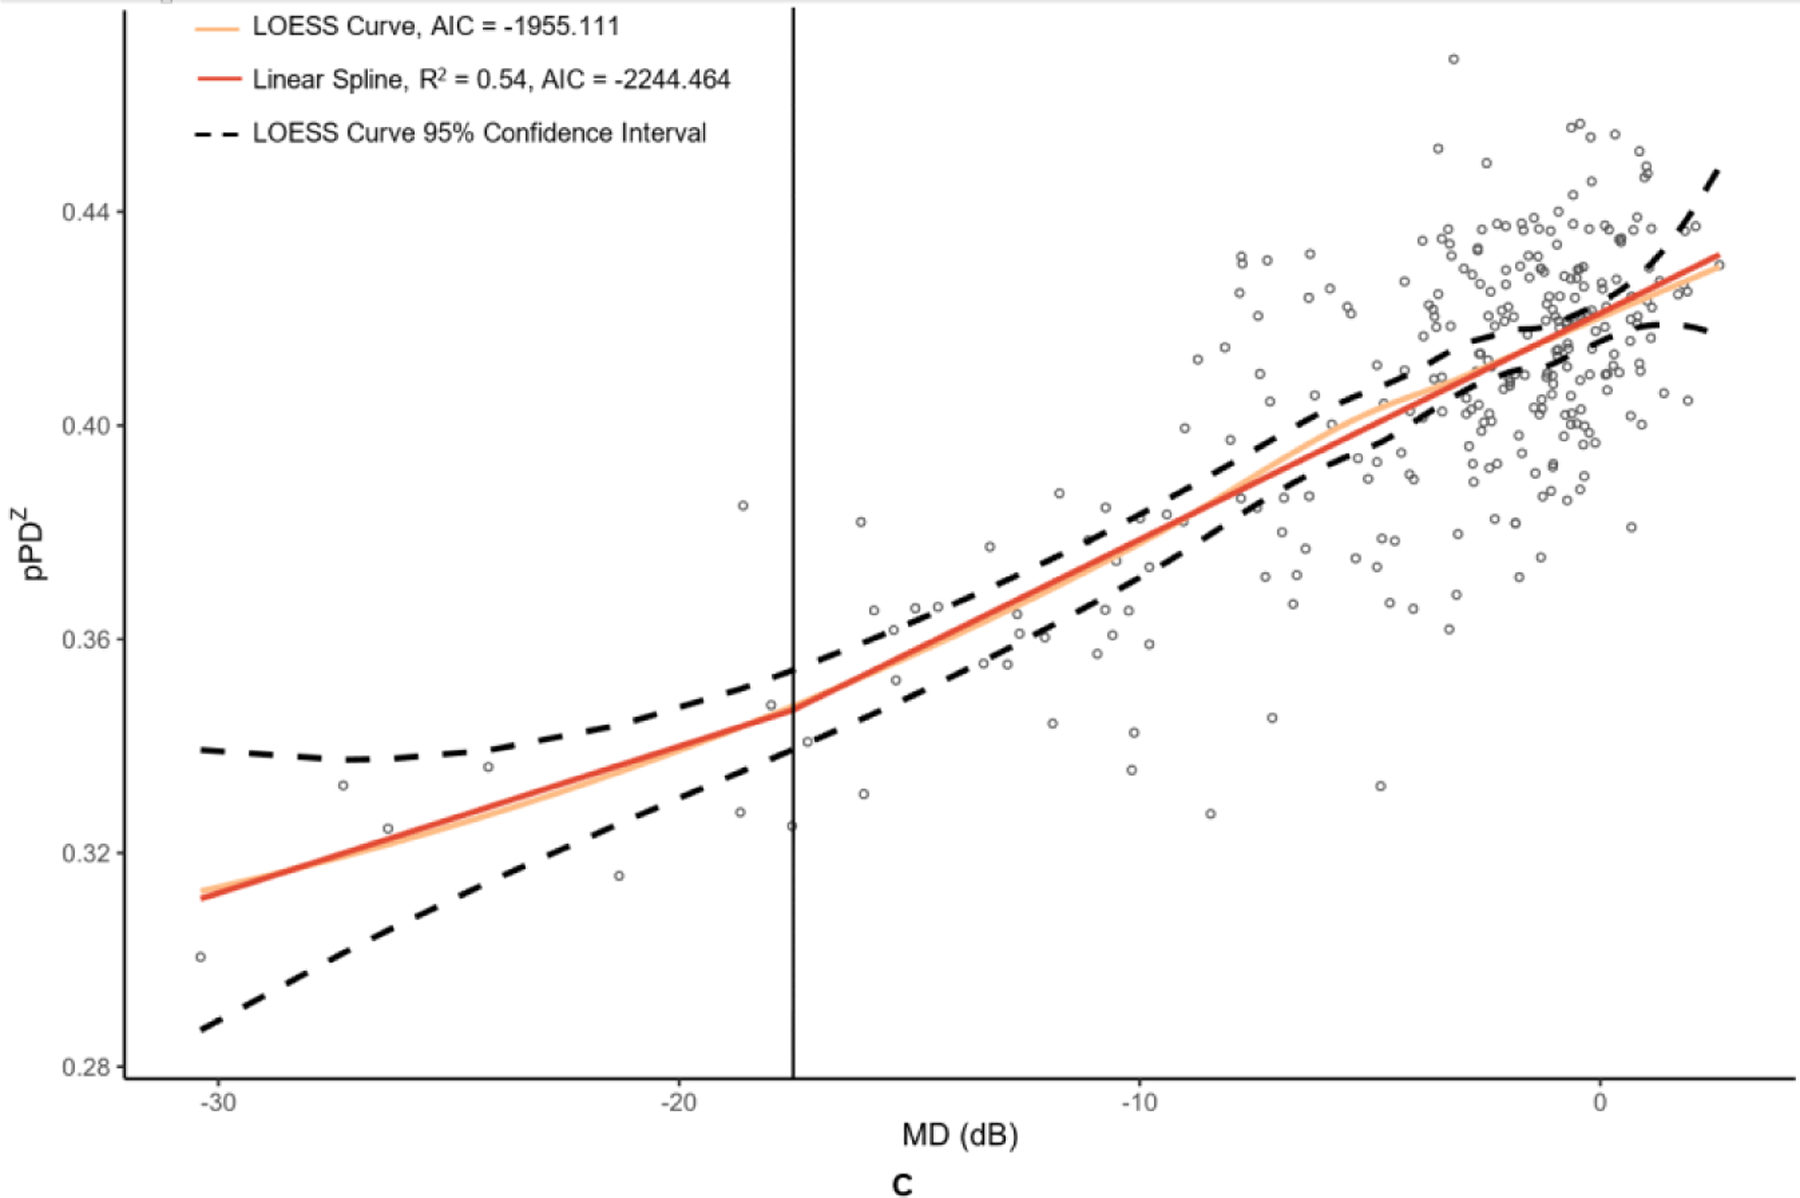
Figure 2. Graphs of peripapillary optical coherence tomography (OCT) and optical coherence tomography angiography (OCTA) metrics versus mean deviation (MD) of 24–2 Humphrey visual field results.


The metrics corresponding to this figure’s graphs are as follows: A = retinal nerve fiber layer (RNFL) (µm), B = peripapillary vessel area density (pVAD), and C = peripapillary perfusion density (pPDZ). dB = decibels. LOESS = local polynomial regression. AIC = Akaike’s information criterion. Vertical lines were added at change points to demarcate the point of transition between α + β (steep) and α (plateau) splines.
