
Figure 2.
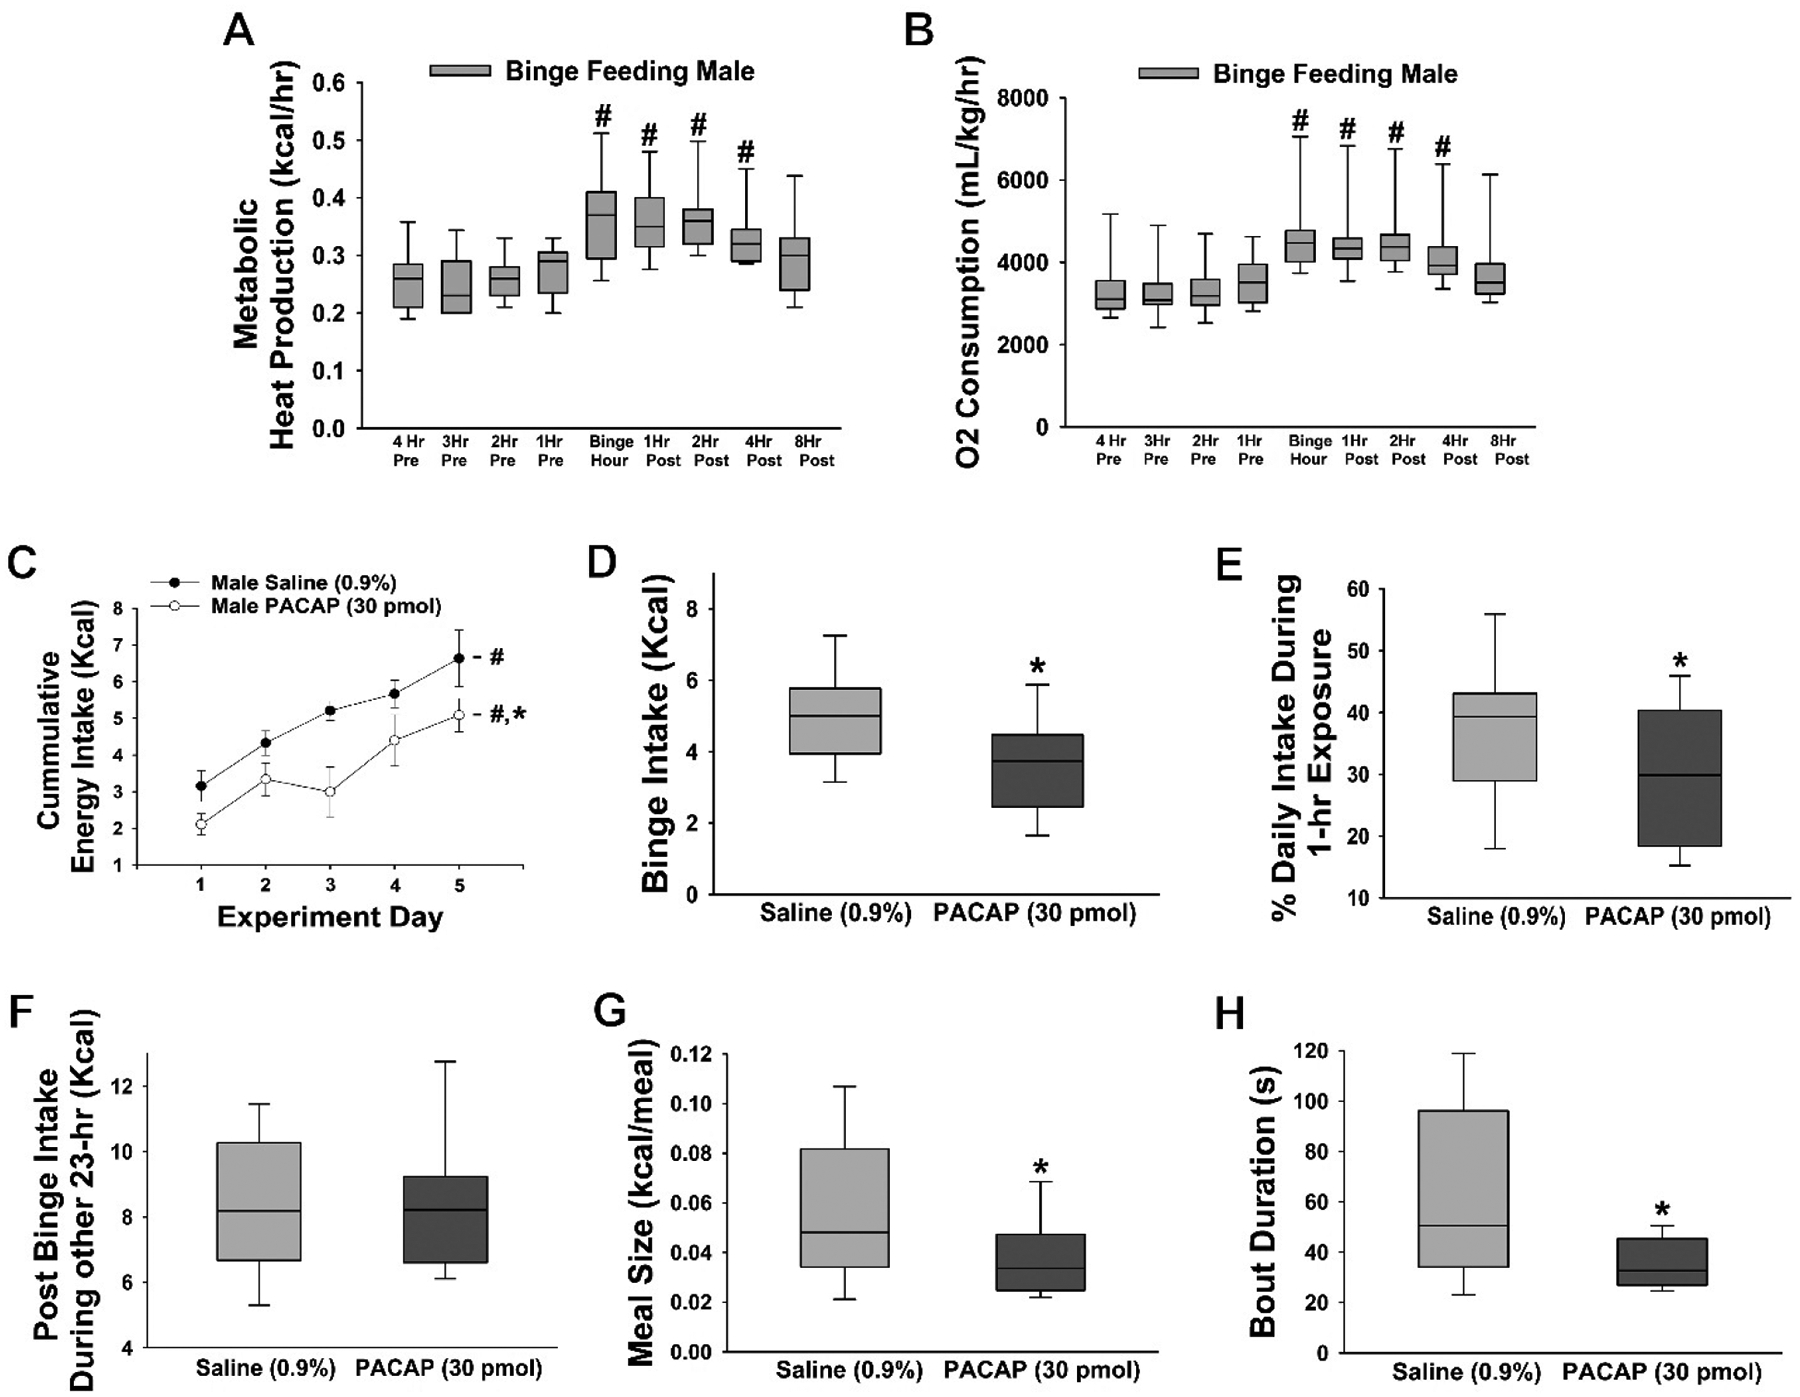
PACAP reduces binge feeding accompanied by decreases in meal size and bout duration. A & B, Pronounced increases in energy expenditure triggered by the binge episode. C-E, The escalation of the daily consumption is significantly dampened by PACAP (30 pmol; VTA; n = 6) as compared to saline-treated controls (n = 6). F, No changes in chow consumption over the remaining 23 hours were observed. G & H, PACAP-induced changes in meal pattern. Symbols represent means and lines 1 SEM. The bars of the box-and-whisker plot represent the median, the 25th and 75th quartiles, whereas the lines depict the 5th and the 95th percentiles. #, p < 0.05 with respect to time (A & B) or day (C), repeated measures ANOVA/LSD; *, p < 0.05; with respect to saline, repeated measures multifactorial ANOVA/LSD (C), Student’s t-test (D, F-H), Mann-Whitney U-test (E).