
Figure 4.
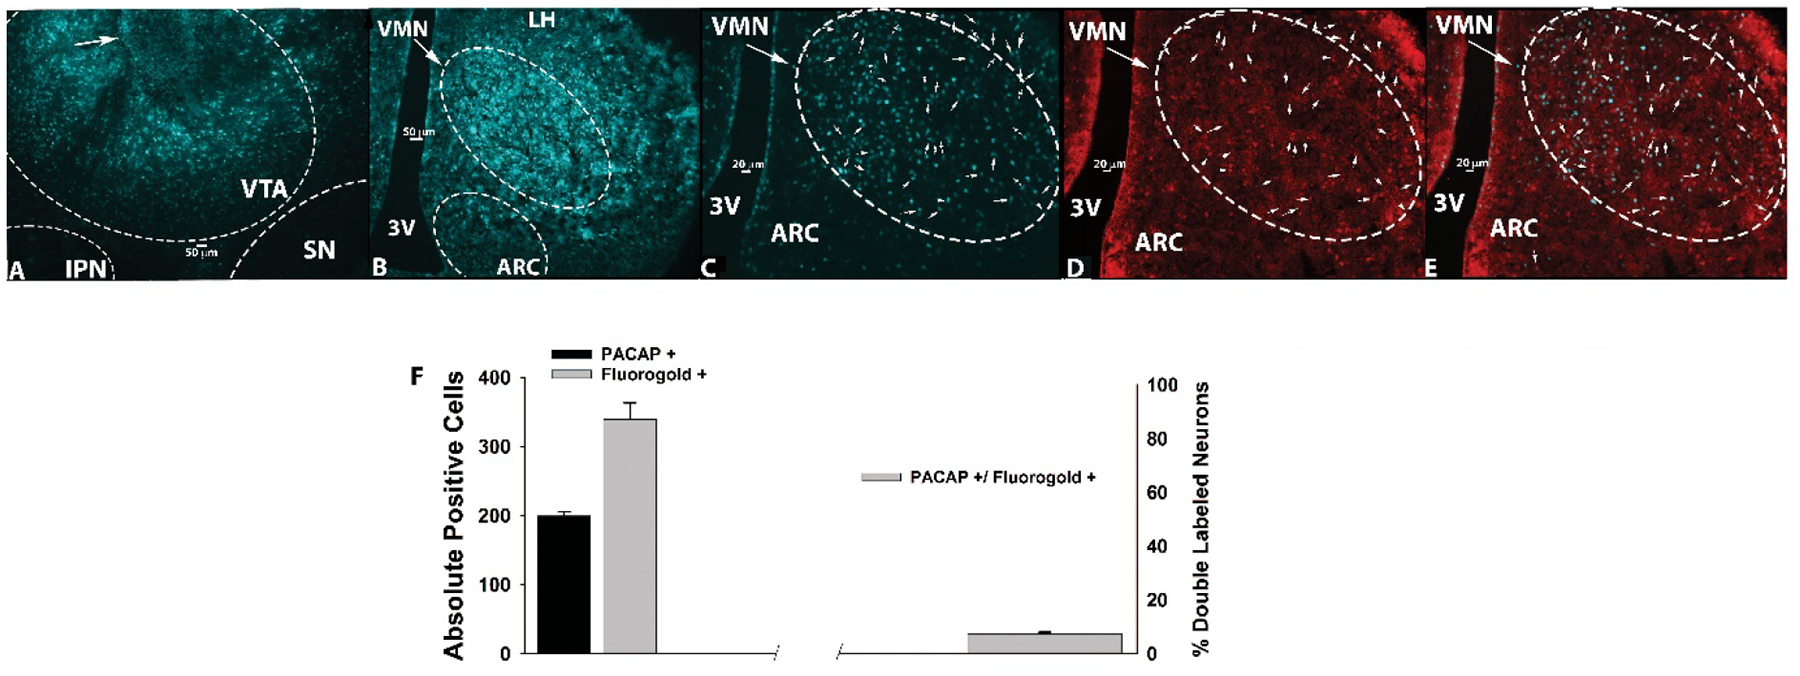
Retrograde tract tracing revealing a subpopulation of PACAP-containing, VTA-projecting VMN neurons. A, The injection site seen within the VTA (5X; denoted by the arrow). B, Fluorogold labelling in the VMN and surrounding areas (5X). C, Fluorogold labelling in the VMN (10X). D, PACAP immunostaining in the VMN as visualized with AF546. E, Composite overlay. Bars represent means and vertical lines 1 SEM. D–E were also photographed at 10X.