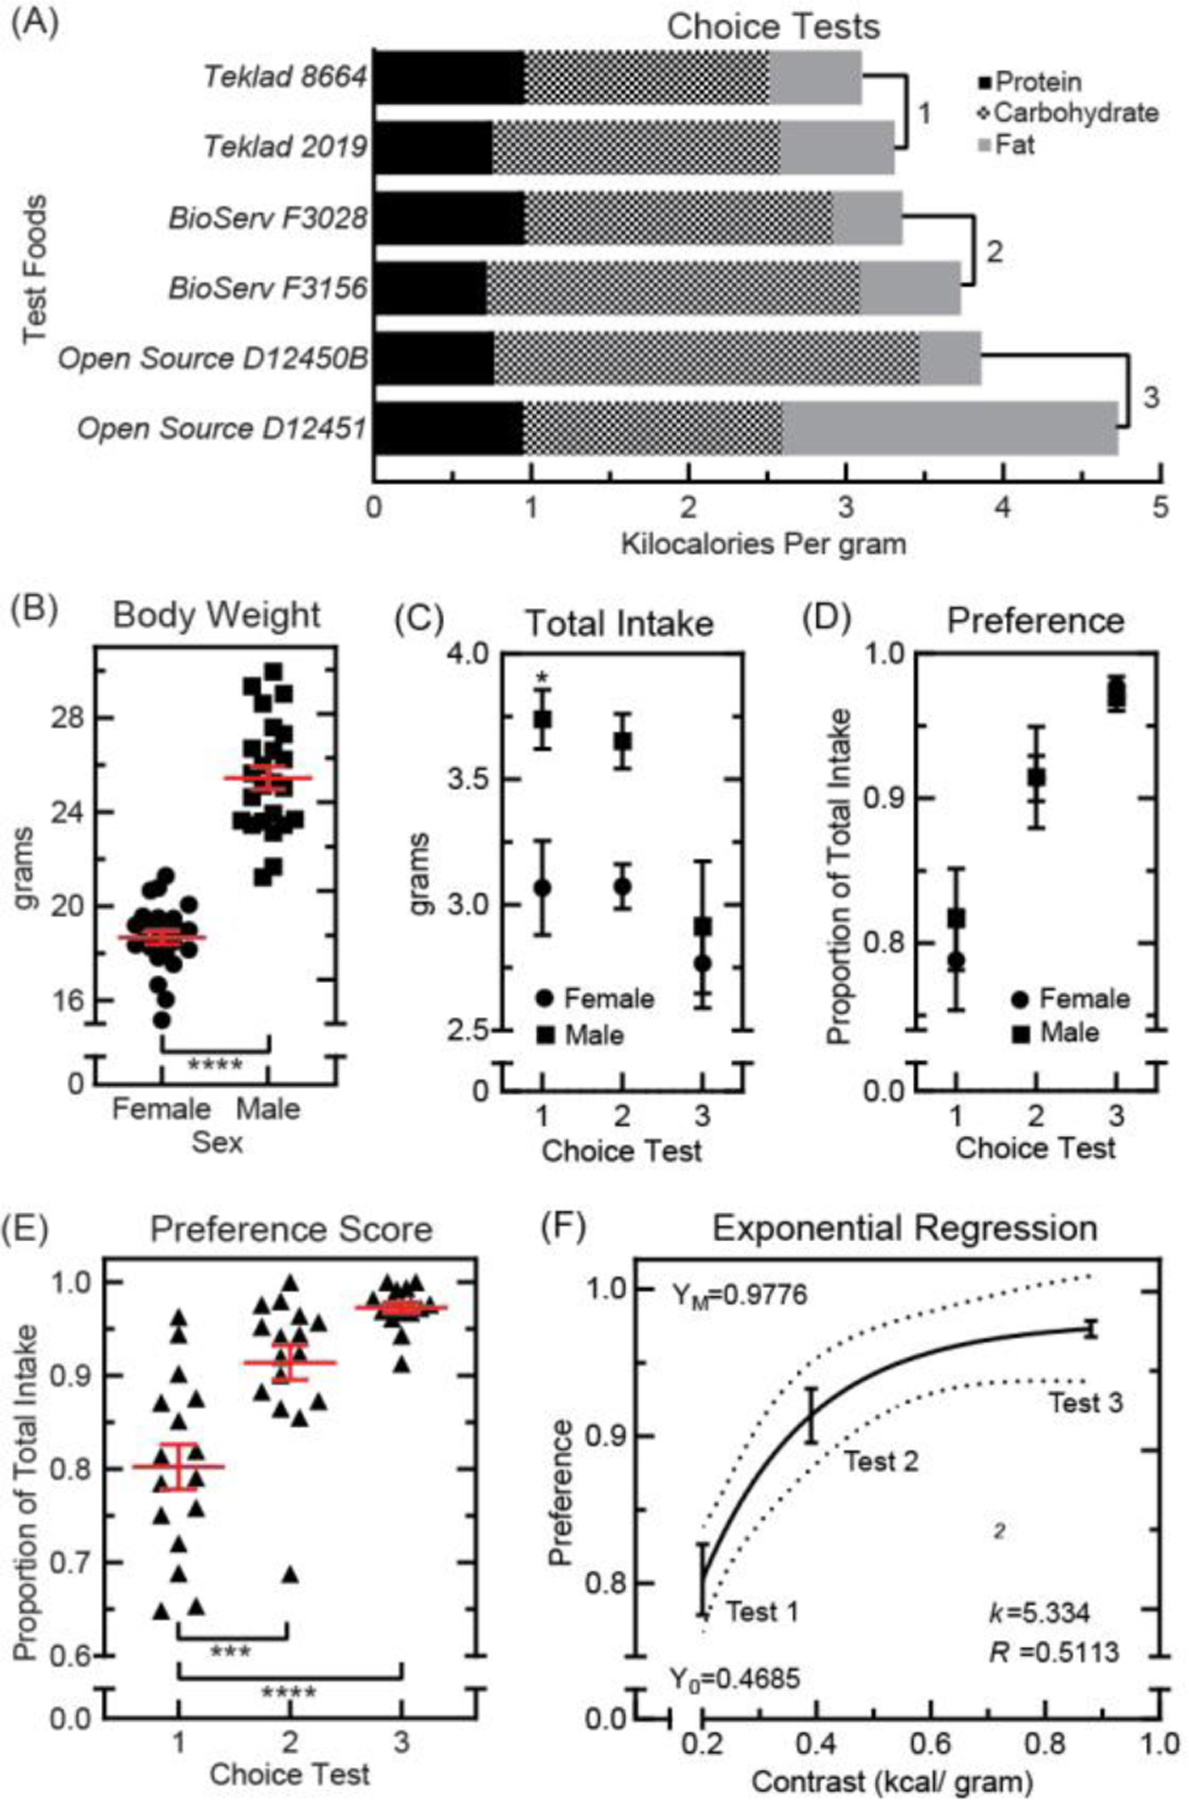
Fig. 1. Food preference tests in 10-week old C57BL6 mice.

Experimentally naive mice were raised on standard chow (Teklad 8664, 3.1 kilocalories per gram) to 10 weeks of age. During three unique choice tests, concurrent intake of two test foods was measured for 24-hours. (A): Nutritional composition of test foods used in choice tests 1–3. (B): Body weight at test start in female (n=24, ●) and male (n=24, ■) mice, compared using two-tailed t test (t=12.04, p<0.0001, df=46; *p<0.05, **p<0.01, ***p<0.001, ****p<0.0001). Means ±s.e.m. (C): Total food eaten during the 24-hour test period (n=8 per group; male ■, female ●). Results were compared using two-way ANOVA [sex: F(1,42)=11.45, p=0.0016; choice test: F(2,42)=7.029, p=0.0023; interaction: F(2,42)=1.402, p=0.2573] with Bonferroni correction for multiple comparisons (*p<0.05). Means ±s.e.m. (D): Proportion of total intake attributable to the energy-superior test food (n=8 per group; male ■, female ●). Results were compared using two-way ANOVA [sex: F(1,42)=0.1067, p=0.7455; intake test: F(2,42)=22.31, p<0.0001; interaction: F(2,42)=0.2651, p=0.7684] with Bonferroni correction for multiple comparisons. Means ±s.e.m. (E): Food preference scores in all mice during choice tests 1–3 (n=16 per group, ▲). Results were compared using one-way ANOVA [F(2,45)=23.54, p<0.0001] with Bonferroni correction for multiple comparisons (*p<0.05, **p<0.01, ***p<0.001, ****p<0.0001). Means ±s.e.m. (F): Exponential plateau regression analysis used to model preference score based on the difference in test food energy-density. Function is plotted with 95% confidence intervals [df=45, sum of squares=0.2293, Sy.x=0.07139]. Means ±s.e.m.
