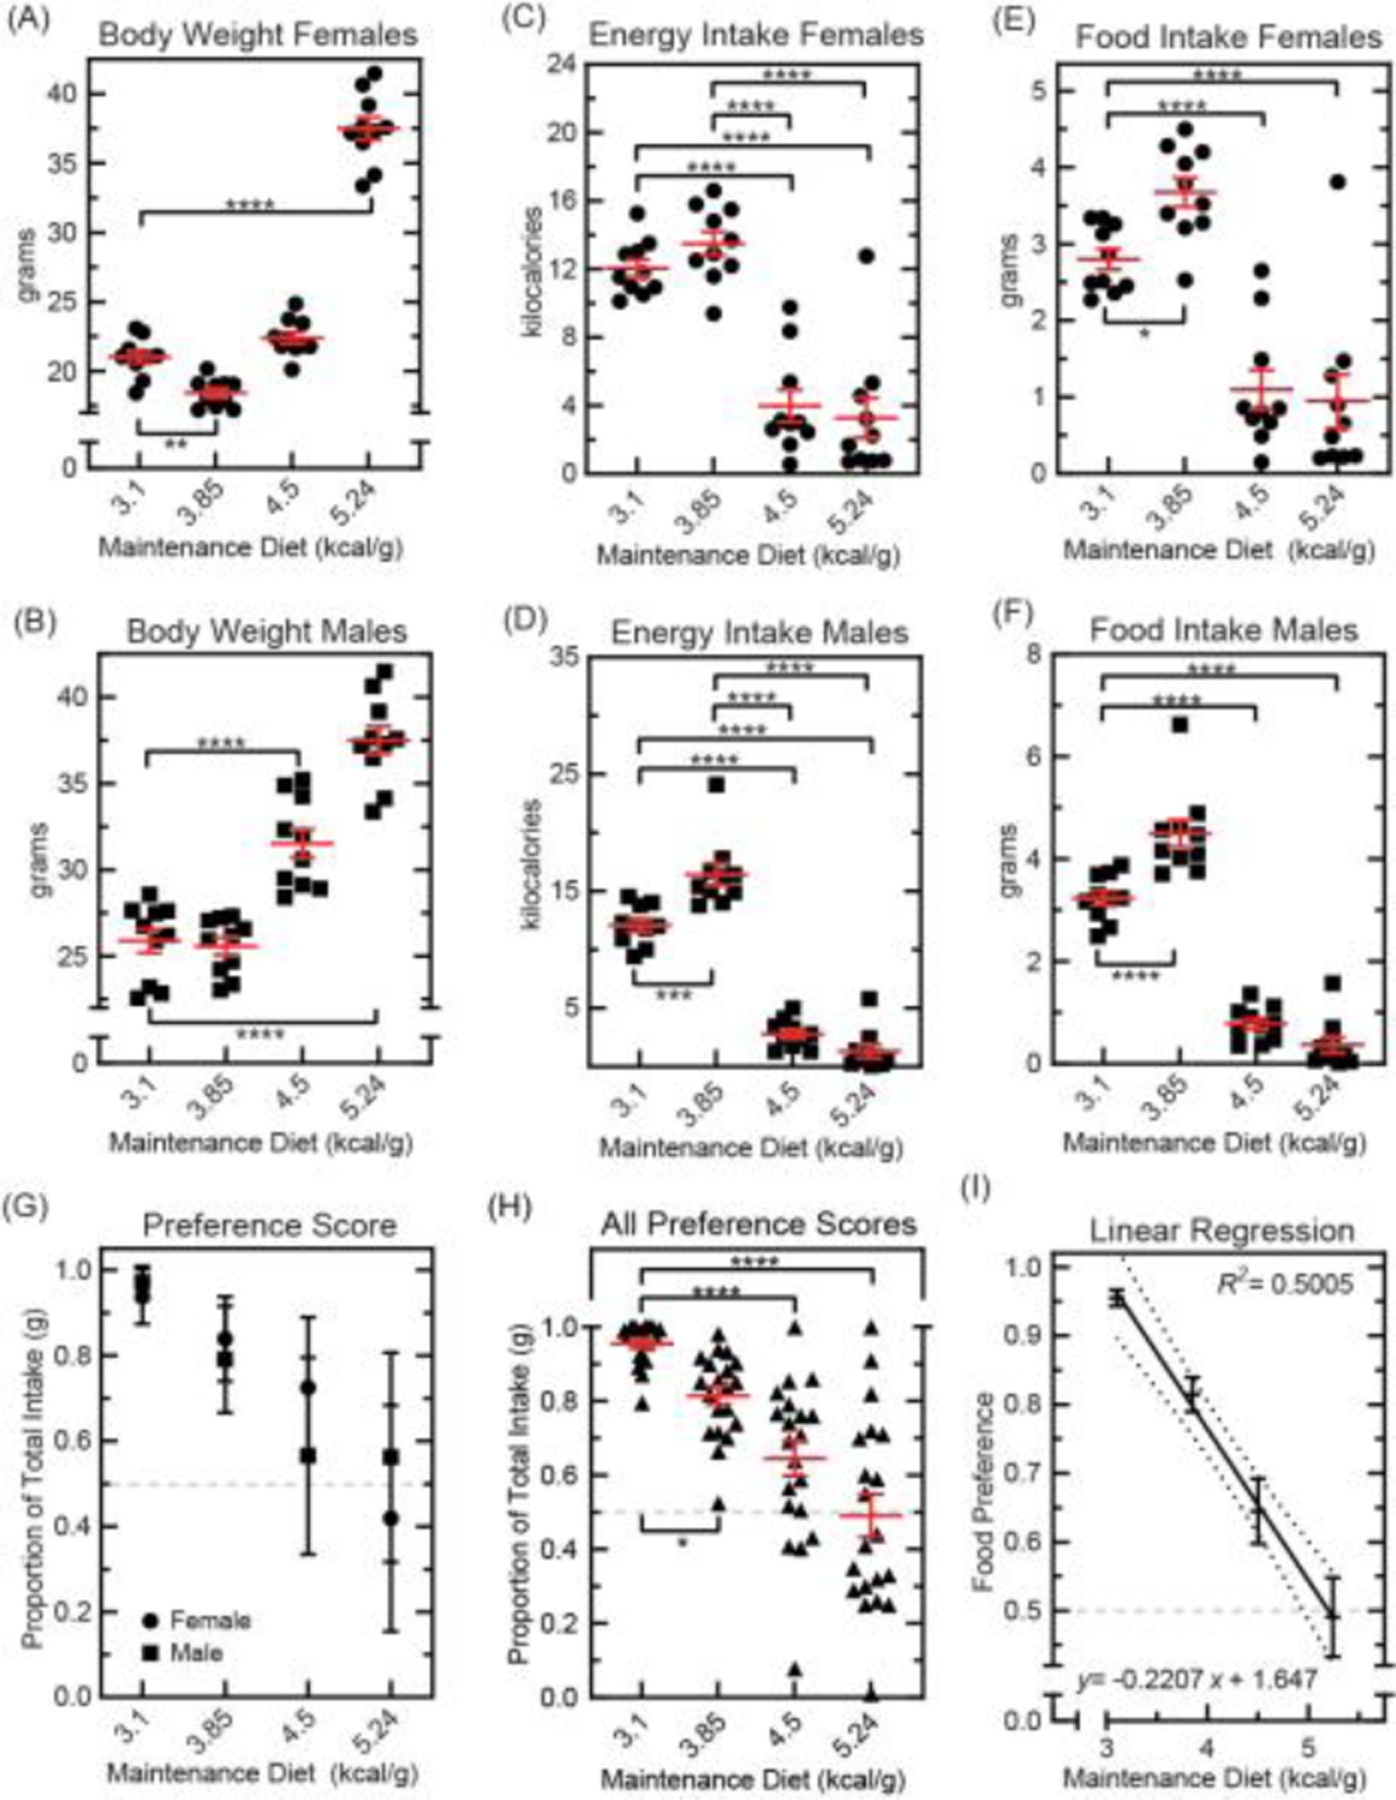
Fig. 3. Food choice in mice fed energy-dense diets.

Mice were raised to 14 weeks on standard chow (Teklad 8664, 3.1 kilocalories per gram) or energy-dense diet (Open Source D12450B, 3.85 kilocalories per gram; Teklad 88317, 4.5 kilocalories per gram; Open Source D12492, 5.24 kilocalories per gram). At 14 weeks, consumption of two test foods was measured for 24 hours: BioServ F3028 (3.35 kilocalories per gram) and Bioserv F3156 (3.74 kilocalories per gram). (A): Body weight in female mice at the start of each test day (n=10 per group, ●). Results were compared using one-way ANOVA [F(3,36)=265.4, p<0.0001] with Bonferroni correction for pairwise comparison with controls (*p<0.05, **p<0.01, ***p<0.001, ****p<0.0001). Means ±s.e.m. (B): Body weight in male mice at the start of each test day (n=10 per group, ■). Results were compared using one-way ANOVA [F(3,36)=61.43, p<0.0001] with Bonferroni correction for pairwise comparison with controls (*p<0.05, **p<0.01, ***p<0.001, ****p<0.0001). Means ±s.e.m. (C): Total energy intake in female mice (n=10 per group, ●) compared using one-way ANOVA [F(3,36)=37.58, p<0.0001] with Bonferroni correction for multiple comparisons (*p<0.05, **p<0.01, ***p<0.001, ****p<0.0001). Means ±s.e.m. (D): Total energy intake in male mice (n=10 per group, ■) compared using one-way ANOVA [F(3,36)=132.3, p<0.0001] with Bonferroni correction for multiple comparisons (*p<0.05, **p<0.01, ***p<0.001, ****p<0.0001). Means ±s.e.m. (E): Total food eaten by female mice during the test period (n=10 per group, ●). Results were compared using one-way ANOVA [F(3,36)=29.30, p<0.0001] with Bonferroni correction for pairwise comparison with control (*p<0.05, **p<0.01, ***p<0.001, ****p<0.0001). Means ±s.e.m. (F): Total food eaten by male mice during the test period (n=10 per group, ■). Results were compared using one-way ANOVA [F(3,36)=125.8, p<0.0001] with Bonferroni correction for pairwise comparison with controls (*p<0.05, **p<0.01, ***p<0.001, ****p<0.0001). Means ±s.e.m. (G): Proportion of total intake from the energy-superior test food in female (n=10 per group, ●) and male (n=10 per group, ■) mice. Results were compared using two-way ANOVA [sex: F(1,72)=0.03910, p=0.8438; maintenance diet: F(3,72)=26.97, p<0.0001; interaction F(3,72)=2.703, p=0.0518] with Bonferroni correction for multiple comparisons. Means ±s.e.m. (H): Proportion of total intake from the energy-superior test food in all mice (n=20 per group). Results were compared using one-way ANOVA [F(3,76)=25.57, p<0.0001] with Bonferroni correction for pairwise comparison with controls (*p<0.05, **p<0.01, ***p<0.001, ****p<0.0001). Means ±s.e.m. (I): Linear regression analysis of preference score and maintenance diet energy-density plotted with 95% confidence intervals.
