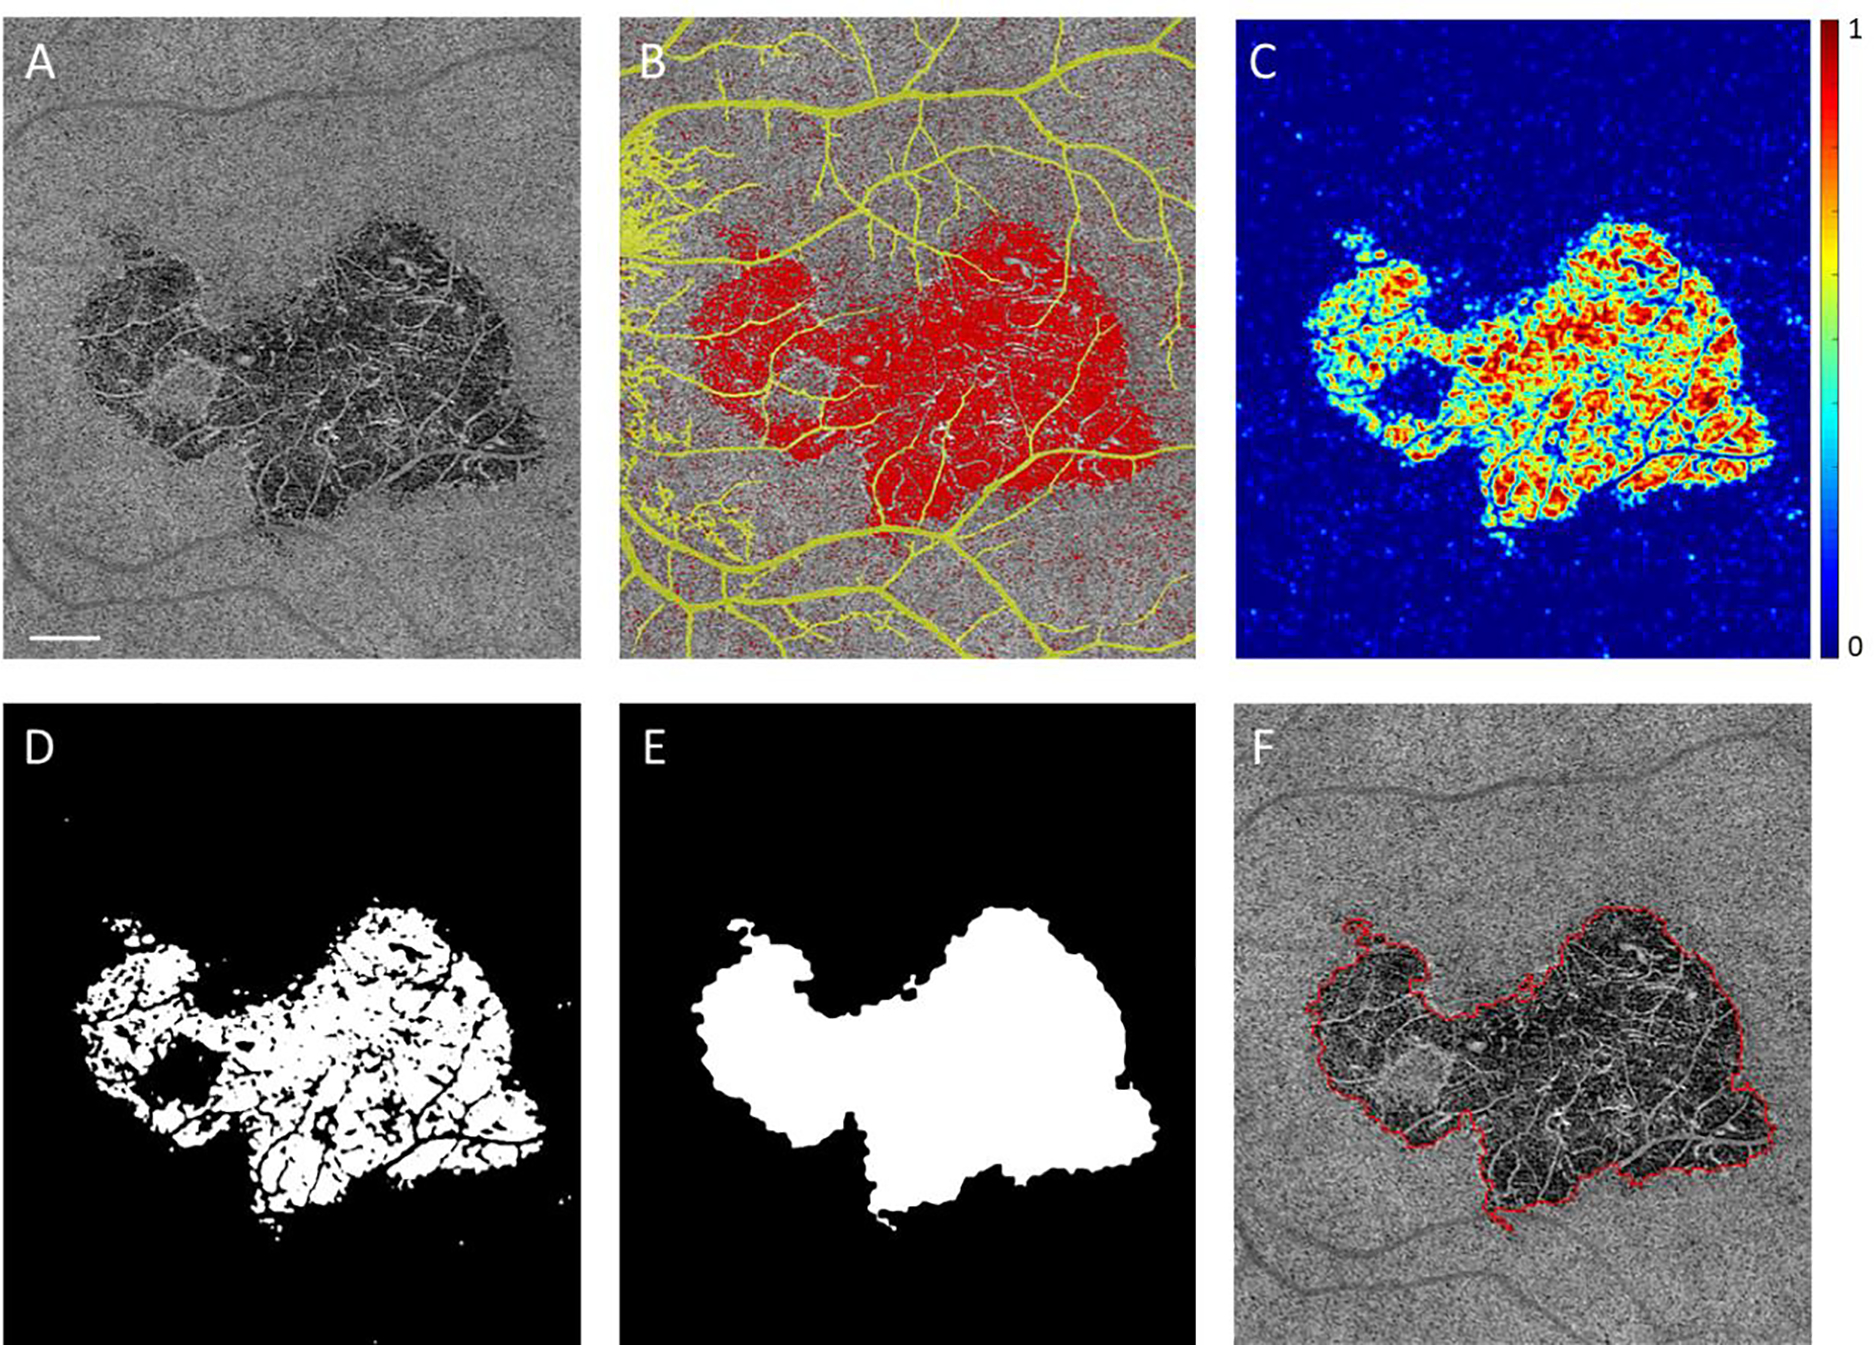
FIGURE 1. Automated choriocapillaris lesion boundary segmentation:

(A) En face image of the choriocapillaris (CC) slab of a patient with macular serpiginous choroiditis (eye 1 on Table 2). (B) Panel A overlaid with automatically identified CC flow deficits (FDs) (in red), and retinal projection artifacts (in yellow). (C) Heat map of local average CC FD density. Generated by applying a ~50 μm moving window onto CC FDs map (in red of panel B). (D) Areas identified as abnormally high local CC FD density (in white), generated by applying a threshold of high local FD density to panel C. (E) Areas segmented as abnormal CC lesion after applying morphological operations on panel D. (F) Final output includes CC lesion boundary (in red) and total lesion area in mm2. Scale bar represents 1 mm.
