
Figure 1. Study design and molecular profiles in HCM.
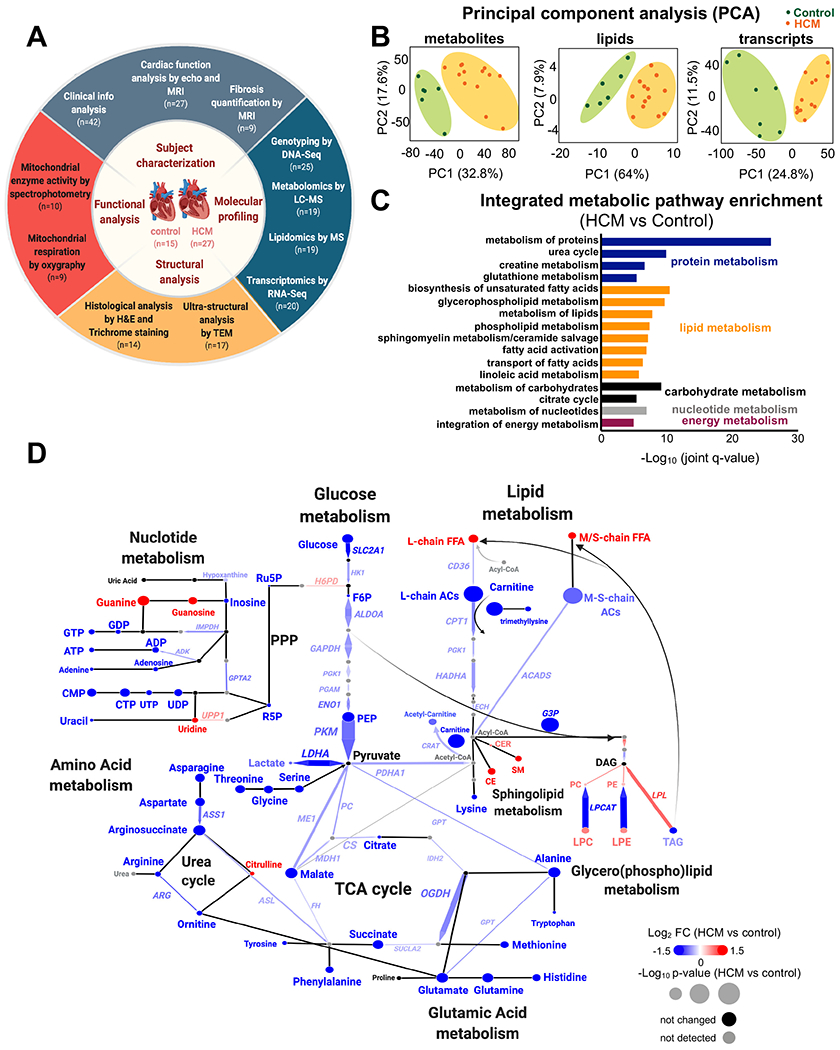
(A) Summary of the experimental design workflow. (B) Metabolomic, lipidomic, and transcriptomic profiling was performed on left ventricle tissue from HCM patients and donor controls. Principal component analysis (PCA) plots of all 6,189 metabolite features(left), 728 lipids (middle), and 48,167 transcripts (right) clearly separate the profiles of HCM from controls. (C) Top metabolic pathways enriched in HCM identified by IMPaLA, integrating metabolites, lipids, and transcripts (FDR<0.05). Metabolic pathways were categorized as follows: proteins, blue; lipids, orange; carbohydrates, black; nucleotides, gray and energy metabolism (purple). (D) Integrated network analysis combining all omic datasets using Shiny Genes and Metabolites (GAM) platform. Resulting networks were annotated and plotted in Cytoscape. Each node (circle) represents a metabolite or lipid and each edge connecting nodes represents an enzyme-encoding transcript based on biochemical relationships. The arrowhead determines the principal direction of the biochemical reaction. The size of each node and of connecting line reflects their p value; the color represents the relative change (blue, decrease; red, increase; black, not significant; and gray, not detected). n=6 control and n=13 HCM samples for metabolites/lipids; n=7 control and n=13 HCM for transcripts. FFA, free fatty acids; M/S-chain, medium/short-chain; L-chain, long chain; AC, acylcarnitine; G3P, glyceraldehyde 3-phosphate; PPP, pentose phosphate pathway; Ru5P, ribulose-5-phosphate; R5P, ribose 5-phosphate; CER, ceramide; CE, cholesterol ester; PC, phosphatidylcholine; PE, phosphatidylethanolamine; LPC, lysophosphatidylcholine; LPE, lysophosphatidylethanolamine; DAG, diacylglycerol; and TAG, triacylglycerol.