
Figure 6.
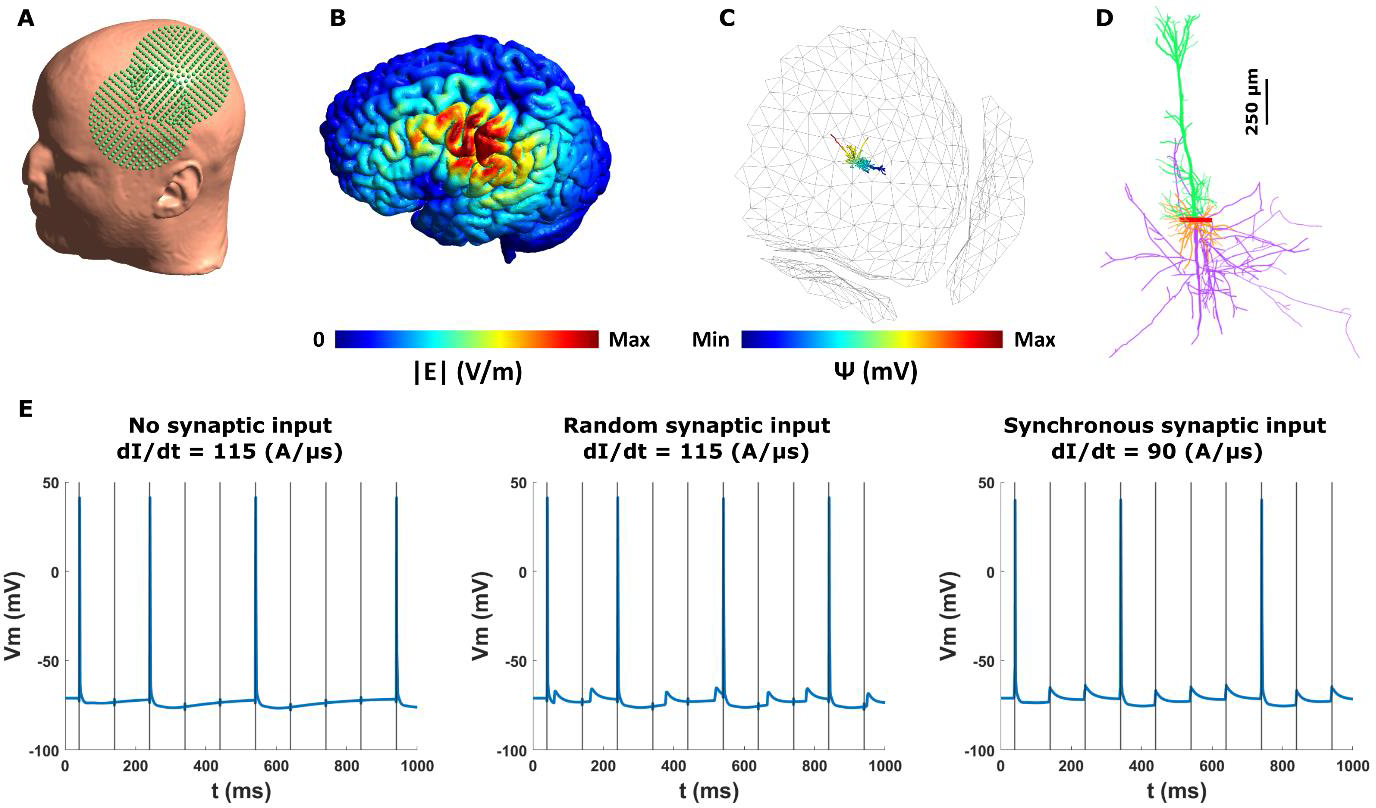
TMS effects in a human neocortical neuron model in a realistic head model (refined Ernie model). (A) TMS coil placement over the left primary motor cortex (M1) at 45° relative to midline. (B) Spatial distribution of the electric field magnitude on the grey matter. The white circle shows the location of the neocortical neuron in the hand knob area of the M1. (C) Neuron placement at the center of the white circle (radius = 5 mm) at the lip of the gyrus. The neuron is oriented normal to the grey matter surface. The quasipotentials induced by the electric fields are overlaid on the neuron. The grey matter surface is made transparent to visualize the neuron. (D) Neocortical neuron morphology. Soma, apical dendrites, basal dendrites, and the axon is shown with red, green, orange, and purple, respectively. (E) Somatic membrane voltage for left. dI/dt = 115 A/μs and no synaptic input; middle. dI/dt = 115 A/μs and random synaptic input (weight = 0.05); and right. dI/dt = 90 A/μs and synchronous synaptic input (weight = 0.05). The neuron does not fire at every TMS pulse due to slow recovery period. Neuronal spiking depends on the synaptic input. Synchronous synaptic input decreases the TMS firing threshold. The grey vertical lines mark the TMS pulses.