
Figure 4. In vivo evaluation of PROTAC-8.
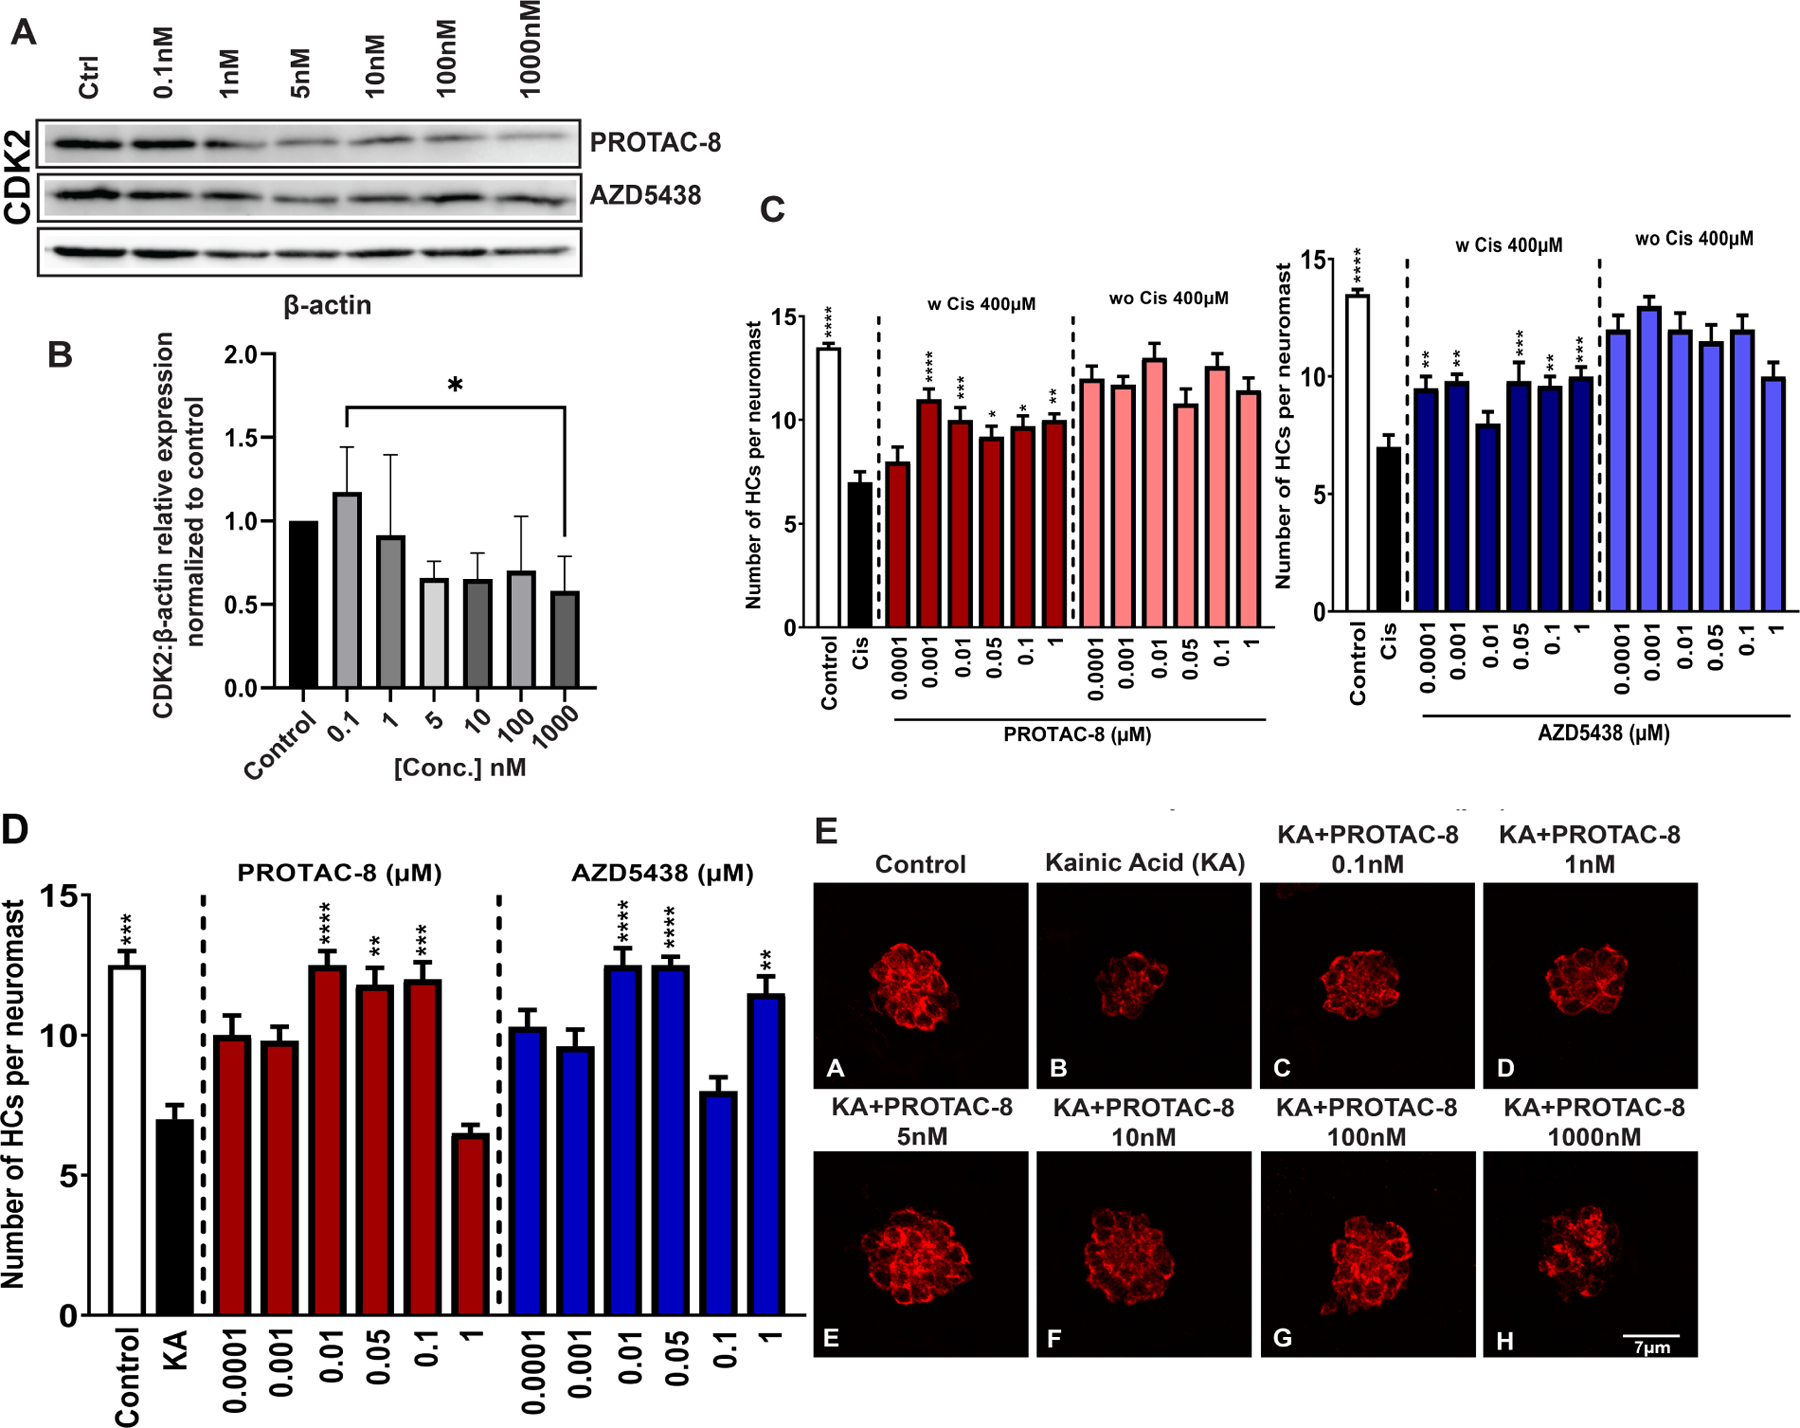
A) Representative immunoblots from the treatment of zebrafish with PROTAC-8 from 0.1nM to 1μM for 24 hours. Although CDK2 abundance seems to be reduced for some of AZD5438 concentrations (i.e., 5 nM and 10 nM), the normalization and quantification data did not show any significant differences compared to control samples.; B) Quantification of the corresponding CDK2 bands from three independent experiments. Kruskal-Wallis followed by Dunn’s post hoc test was used for comparison between the groups where *P < 0.05; **P < 0.01; C) The number of hair cells per neuromast was quantified after treatment with PROTAC-8 (left) or AZD5438 (right) in the presence or absence of 400μM of Cisplatin. Results are expressed as mean ± SEM. Statistical analysis: 1-way ANOVA with correction for Dunnett’s multiple comparisons test. **P < 0.01; ***P < 0.001; ****P < 0.0001 versus cisplatin treatment; Black bar: media-treated control; white bar: cisplatin-treated control; D) The number of hair cells per neuromast was quantified after pre-treatment with PROTAC-8 or AZD5438 followed by kainic acid (KA) 300μM for 50min. Results are expressed as mean ± SEM. Statistical analysis: 1-way ANOVA with correction for Dunnett’s multiple comparisons test. **P < 0.01; ***P < 0.001; ****P < 0.0001 versus KA alone; E) Representative images of 5 dpf zebrafish pretreated with PROTAC-8 (0.1nM-1μM) followed by incubation with KA.