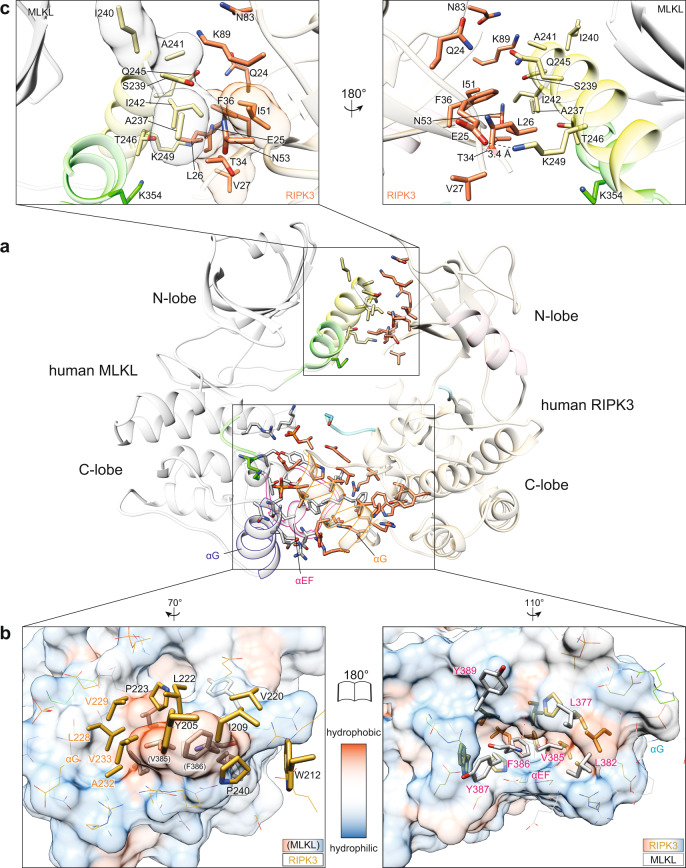
Fig. 4. The human RIPK3 and MLKL complex interface is dominated by C-lobe interactions.
a The N-lobe interaction interface (top box) is less extensive than the C-lobe interface (bottom box). MLKL is colored gray with αC helix (yellow) and activation loop (green) highlighted. RIPK3 is colored magenta with αC helix (wheat) and activation loop (cyan) highlighted. Sidechains of interface residues (as predicted by PDBePISA) are shown as sticks. b Open book view of hydrophobic interacting residues within the C-lobe interface. RIPK3 sidechains are shown as orange sticks and MLKL sidechains as gray. The surfaces (left, MLKL; right, RIPK3) are colored according to hydrophobicity (red) and hydrophilicity (blue), as calculated by UCSF Chimera76. Other polar interface residues are shown as lines. c Zoomed and orthogonal views of the N-lobe interface of human RIPK3:MLKL shown in the box in panel a. Interface residues are shown as sticks; hydrophobic residues are shown as transparent surfaces; an electrostatic interaction is shown as a dashed line.

