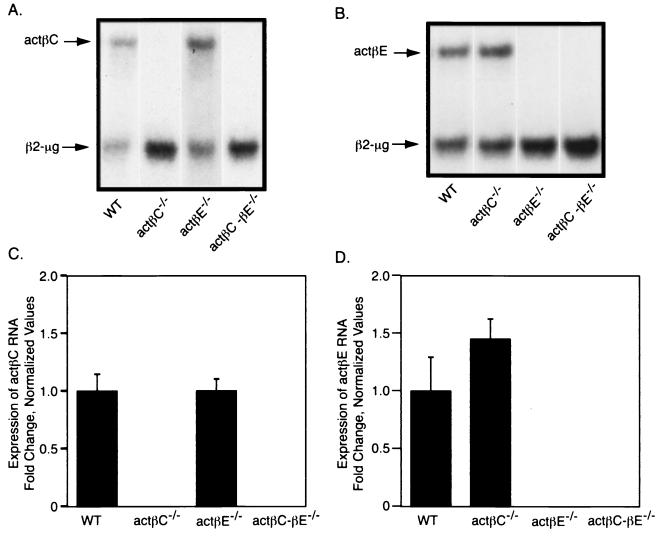
FIG. 2.
Analysis of activin βC and βE expression in actβCm1/actβCm1, actβEm1/actβEm1, and actβCm1-actβEm1 homozygous mice. RNase protection was used to examine the expression of actβC (A) and actβE (B) RNA expression in actβCm1/actβCm1, actβEm1/actβEm1, and actβCm1-actβEm1 homozygous mutant mice. β2-Microglobulin was used as the internal control. Representative lanes from a single experiment are shown. Phosphorimaging was used to quantitate the expression of actβC (C) and actβE (D). All values were normalized to the average ratio of activin subunit expression to β2-microglobulin expression in wild-type mice. The bars show means ± standard errors of the means. Values were not statistically significant (P > 0.05) compared to the wild type. n = 5 for all genotypes. WT, wild type; actβC, activin βC; actβE, activin βE; actβC-βE, activin βC-βE; β2-μg, β2-microglobulin.

