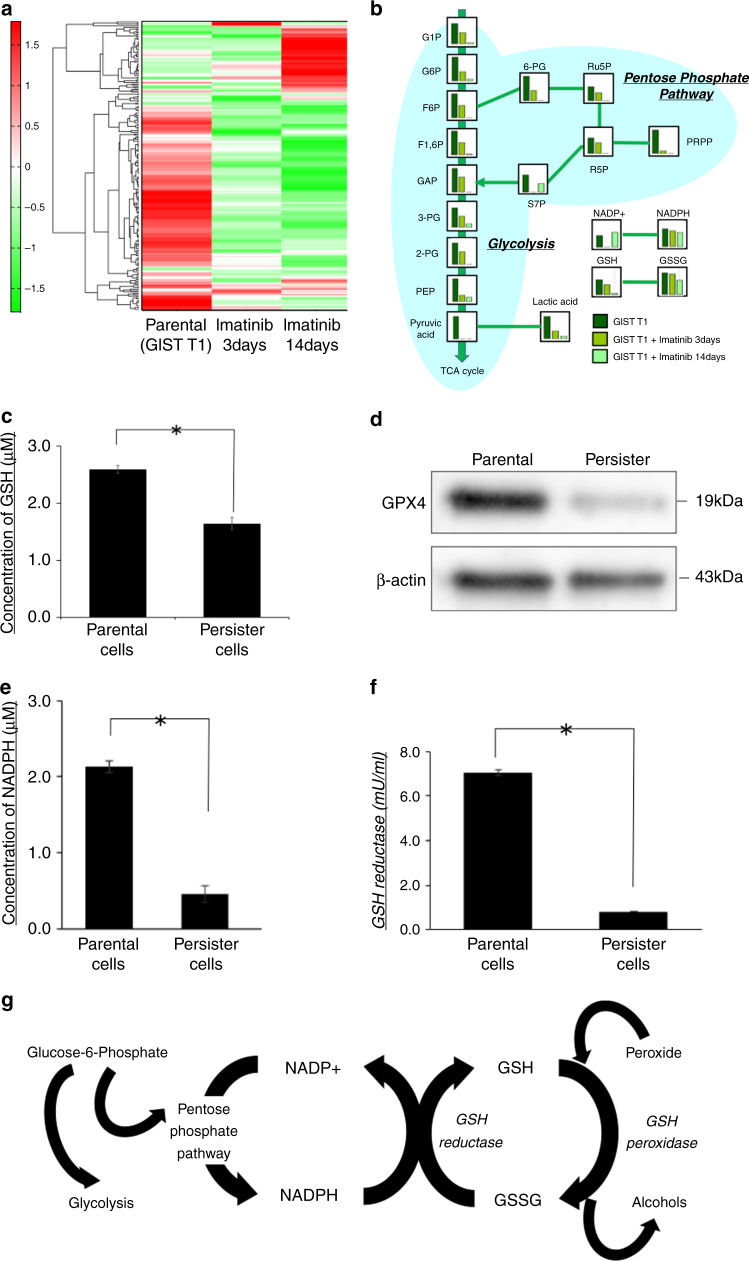
Fig. 2. GSH-related metabolic change in persister cells.
a Heatmap analysis of metabolomes from gastrointestinal stromal tumour (GIST)-T1 parental cells and cells treated with imatinib for 3 and 14 days. b The detailed results of metabolome analysis, which focused on the glucose-related metabolites. c Intracellular concentration of glutathione (GSH) in parental and persister cells measured by GSH-Glo assay. Data represent mean ± standard deviation (SD) (n = 4), *P < 0.05. d Western blotting analysis of GPX4 in parental and persister cells. e Intracellular concentration of NADPH in parental and persister GIST-T1 cells was measured by NADP/NADPH assay. Data represent mean ± SD (n = 4), *P < 0.05. f Intracellular concentration of glutathione reductase of parental and persister cells measured by the OxiSelect Glutathione Reductase Assay Kit. Data represent mean ± SD (n = 4), *P < 0.05. g Schematic of a pathway that characterises the GSH-related metabolism.

