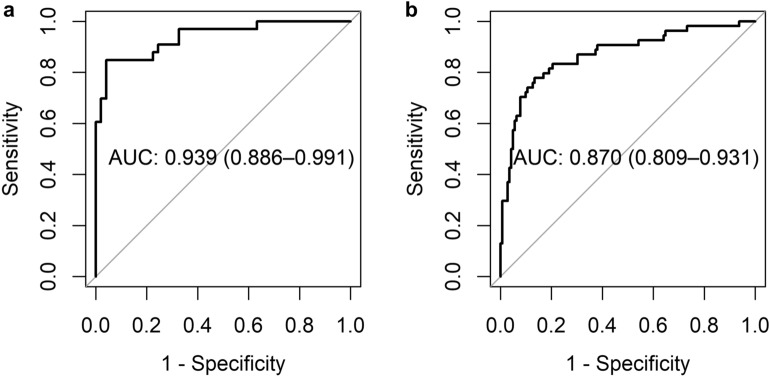
Figure 3.
Performance of our model for detecting EBV + MSI/dMMR. ROC curves and AUCs (95%CI) are shown for UTokyo test cases (a) and TCGA test cases (b). This shows the performance of the model trained with data augmentation and the addition of a part of TCGA cases as training data. AUC- Area under the curve, CI- confidence interval, EBV- Epstein-Barr virus, MSI- microsatellite instability, dMMR- mismatch repair deficiency, ROC-Receiver operating characteristic curve, TCGA- The cancer genome atlas, UTokyo- University of Tokyo.

