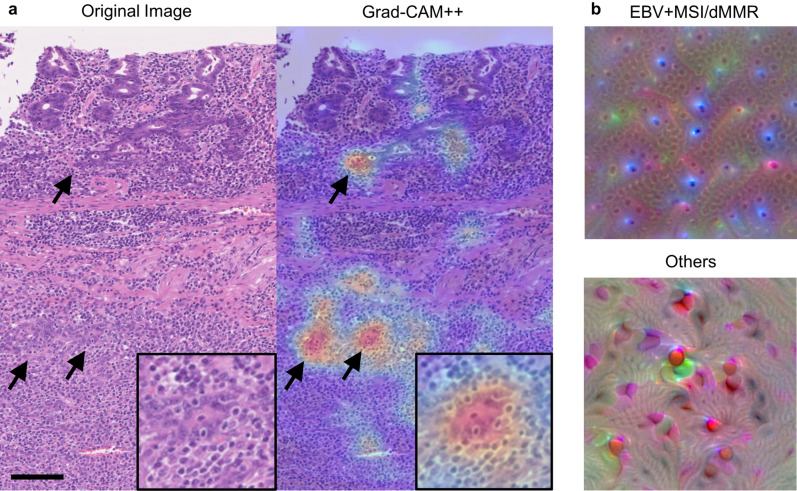
Figure 4.
Visualization of the trained network. (a) An example of applying Grad- CAM++ to an H&E image (left) of an EBV gastric cancer. Grad- CAM++ (right) highlights the most discriminative area in this image to explain the decision made by the trained neural network (arrow). In a higher magnification (inset), intraepithelial lymphocytosis seems to be the most responsible focus for discriminating EBV + MSI/dMMR from others. Scale bar: 100 µm. (b) Created images with the highest probability to be predicted as “EBV + MSI/dMMR” (upper) and “others” (lower) with the method of activation maximization. In the former, the created image seems to represent intraepithelial lymphocytosis. EBV- Epstein-Barr virus, Grad-CAM-gradient-weighted class activation mapping, MSI- microsatellite instability, dMMR- mismatch repair deficiency.

