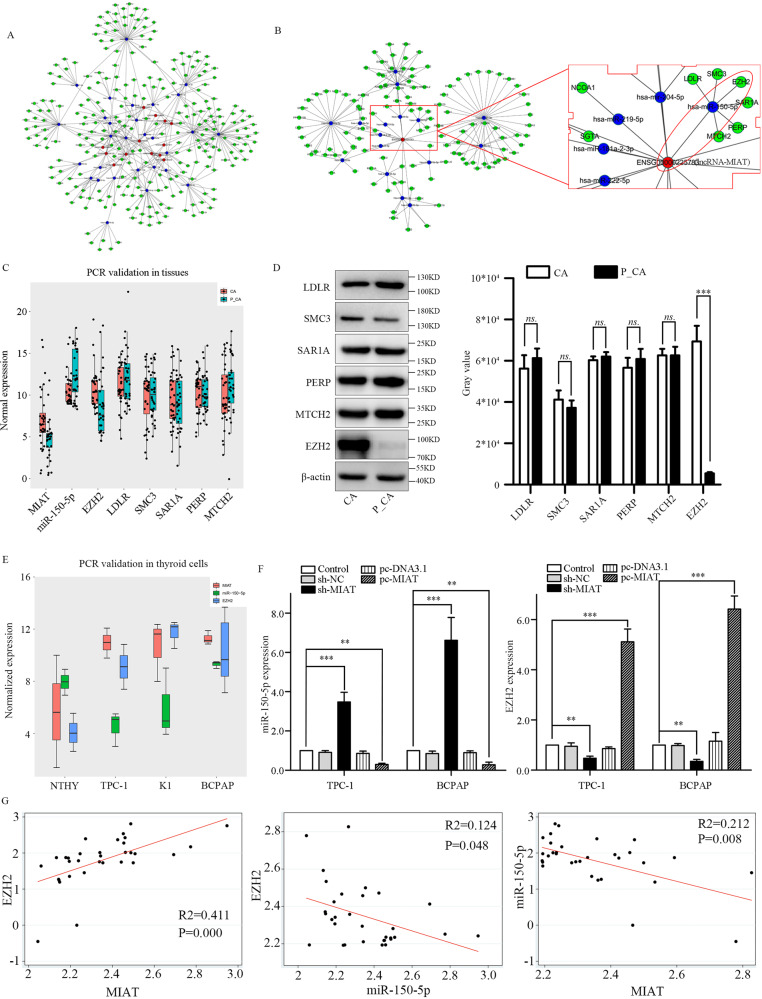
Fig. 3. Interaction among three components of the ceRNA network.
A An ceRNA network including 15 lncRNAs, 28 miRNAs, and hundreds of mRNAs were involved. The red dot represented the lncRNA, the blue dot represented the miRNA and the green ones represented the mRNA. B Construction of the ceRNA network demonstrated a relationship among lncRNA-MIAT, miR-150-5p, and EZH2. C MIAT, miR-150-5p and EZH2, LDLR, SMC3, SAR1A, PERP, MTCH2 expression in cancer tissue and para-cancer tissues. D The western blot of EZH2, LDLR, SMC3, SAR1A, PERP, MTCH2 in cancer and para-cancer tissues. E MIAT, miR-150-5p, and EZH2 expression in NTHY, TPC-1, K1, and BCPAP cells. F miR-150-5p and EZH2 expression in TPC-1 and BCPAP cells when sh-MIAT and pc-MIAT were used. G The Pearson’s correlation between lncRNA-MIAT, miR-150-5p, and EZH2 in PTC tissues. *P < 0.05, **P < 0.01, ***P < 0.001 compared with control cells, n.s. non-significant, using two-tailed t-test analysis.

