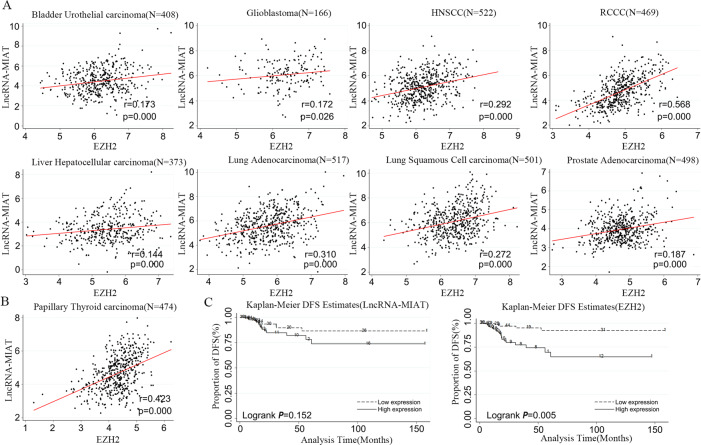
Fig. 4. The correlation between lncRNA-MIAT and EZH2 validated by data from TCGA.
A Regression analysis between lncRNA-MIAT and EZH2 in urothelial carcinoma, glioblastoma, head and neck squamous cell carcinoma (HNSCC), renal clear cell carcinoma (RCCC), hepatocellular carcinoma, lung adenocarcinoma, lung squamous cell carcinoma, and prostate adenocarcinoma. lncRNA-MIAT expression was positively correlated with EZH2 expression (P < 0.01). B Regression analysis between lncRNA-MIAT and EZH2 in PTC. C The Kaplan–Meier DFS estimate curves of lncRNA-MIAT and EZH2.

