Figure 1.
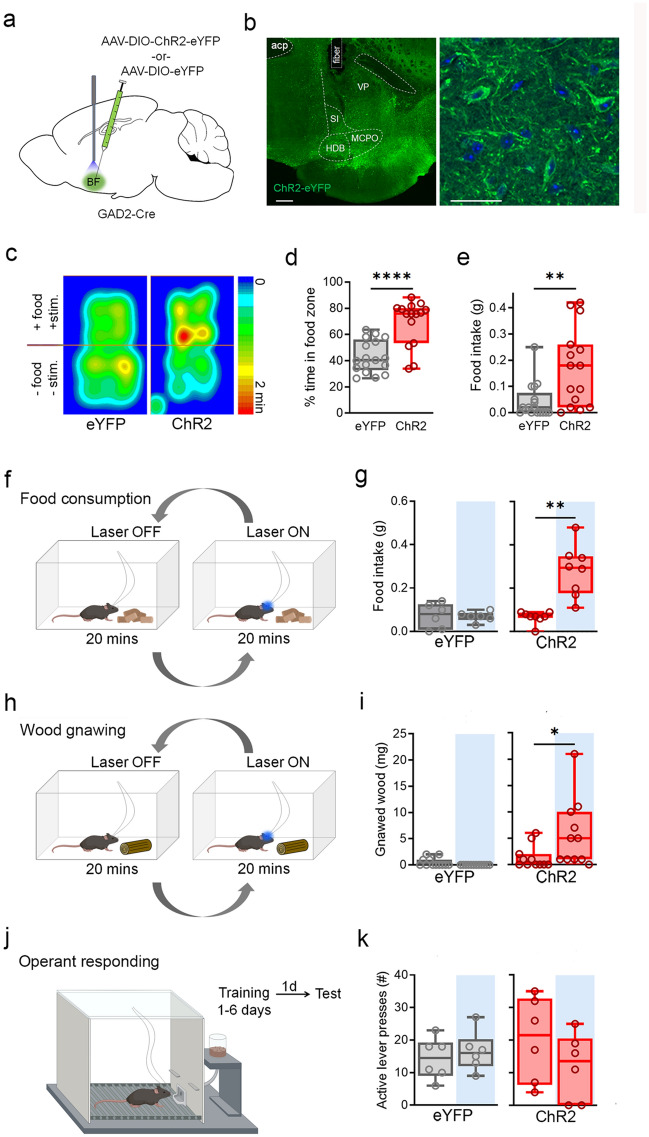
Activation of BFGAD2+ neurons increases consummatory drive. (a) Stereotaxic targeting of viral vectors and optogenetic stimulation. (b) Confocal image of viral expression and optic fiber placement in BF, 200 µm scale bar. Right panel, high power inset of ChR2-expressing neurons in BF, 50 µm scale bar. Blue channel: 4′,6-diamidino-2-phenylindole (DAPI). (c) Heatmap of center body location, mean of eYFP and ChR2 groups, during test of food exposure paired with optic stimulation. One side of the arena contained food pellets, whereupon entry triggered optic stimulation. (d) Percent time spent in food zone. Mann–Whitney test, U = 36, ***p < 0.001. ChR2, n = 15; eYFP, n = 17. (e) Food intake, ingested mass. Mann–Whitney test, U = 54.5, **p < 0.01. ChR2, n = 15; eYFP n = 17. (f) Design for food consumption assay: food biscuits were place at the bottom of the behavioral box and food intake was measured in the presence and absence of laser stimulation, in a counterbalance fashion. (g) Food intake, ingested mass during laserOFF and laserON epochs. Wilcoxon signed rank test, W = 36, **p < 0.01. ChR2, n = 8; eYFP n = 6. (h) Design for test of wood gnawing behavior, wherein animals were exposed to a willow tree branch with and without laser stimulation, in a counterbalanced fashion. (i) Amount of wood removed due to gnawing during laserON vs laserOFF epochs. ChR2, Wilcoxon signed rank test, W = 44, *p < 0.05. ChR2, n = 11; eYFP, n = 12. (j) Design of test for operant responding for food. Task entails discrimination between two levers, only one of which upon pressing will result in food delivery. (k) Active lever presses during laserON vs laserOFF epochs. ChR2, n = 6; eYFP, n = 6. Schematics (a,f,h,j) were created using BioRender.com and PowerPoint.

