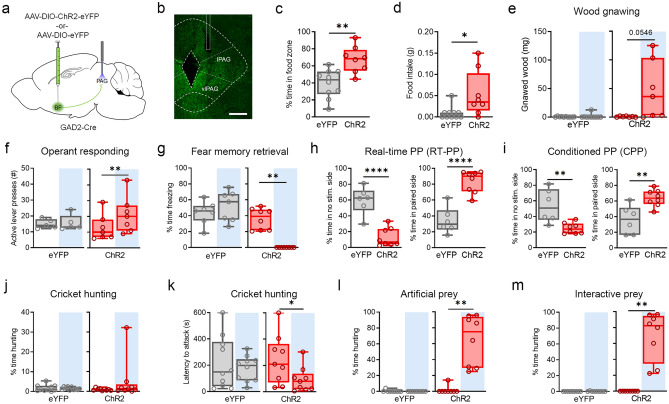
Figure 5.
PAG projections mediate BF effects on consumption, reinforcement and predatory hunting. (a) Stereotaxic targeting of viral vectors and optogenetic stimulation. (b) Confocal image of viral expression and optic fiber placement in BF, 200 µm scale bar. (c) Percent time spent in food zone during optic stimulation paired with food. Mann–Whitney test, U = 14, *p < 0.05. ChR2, n = 8; eYFP, n = 10. (d) Food intake, ingested mass. Unpaired t-test, t16 = 3.66. **p < 0.01. ChR2, n = 8; eYFP, n = 10. (e) Amount of wood removed due to gnawing during laserON vs laserOFF epochs. ChR2, paired t-test, t6 = 2.38. ChR2, n = 7; eYFP, n = 10. (f) Active lever presses during test of operant responding for food. ChR2, paired t-test, t6 = 3.78, *p < 0.05. ChR2, n = 7; eYFP, n = 5. (g) CS-evoked freezing during laserON vs. laserOFF CS trials, following the experimental design in Fig. 2d. ChR2, Wilcoxon signed rank test, W = − 36, **p < 0.01. ChR2, n = 8; eYFP, n = 7. (h) Real-time place preference, measured on day 1 during photostimulation. Percent time in unpaired side, unpaired t-test, t12 = 6.03, ****p < 0.0001. Percent time in stimulation paired side, paired t-test, t12 = 6.06, ****p < 0.0001. ChR2, n = 8; eYFP, n = 6. (i) Conditioned place preference, measured on day 2 in the absence of photostimulation. Percent time in unpaired side, paired t-test, t12 = 3.62, **p < 0.01. Percent time in stimulation paired side, paired t-test, t12 = 3.62, **p < 0.01. ChR2, n = 8; eYFP, n = 6. (j) Percent time spent hunting in the live cricket assay. ChR2, n = 9; eYFP, n = 10. (k) Latency to attack in the live cricket assay. ChR2, paired t-test, t8 = 2.82, *p < 0.05. ChR2, n = 9; eYFP, n = 10. (l) Percent time hunting in the artificial prey assay. ChR2, Wilcoxon signed rank test, W = 36, **p < 0.01. ChR2, n = 8; eYFP, n = 9. (m) Percent time hunting in the interactive artificial prey assay. ChR2, Wilcoxon signed rank test, W = 36, **p < 0.01. ChR2, n = 8; eYFP, n = 9. Schematic (a) was created using BioRender.com and PowerPoint.

