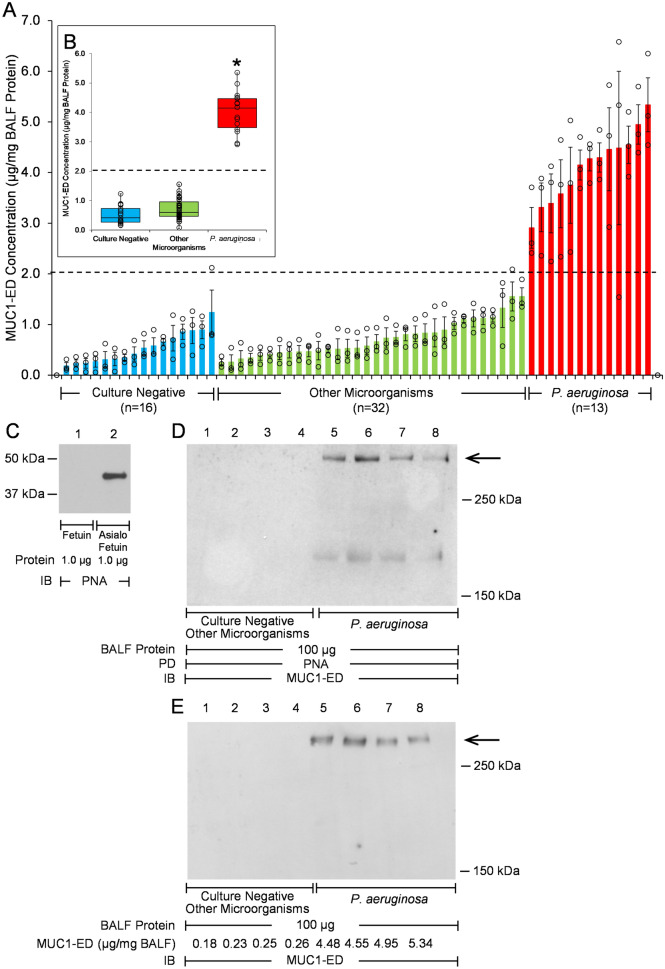
Figure 2.
MUC1-ED levels are increased in BALF from P. aeruginosa-infected VAP patients. (A) MUC1-ED levels in BALF from noninfected patients (n = 16), patients infected with microorganisms other than Pa (n = 32), or Pa-infected patients (n = 13) were quantified by ELISA and normalized to total BALF protein. The dashed line represents an arbitrary cut-off value to differentiate BALF MUC1-ED levels in Pa-infected patients from patients infected with microorganisms other than Pa or noninfected patients. Bars represent mean ± S.E. values (n = 3). Open circles represent individual values. (B) Box and whisker plots of the data in (A). *, increased MUC1-ED levels compared with noninfected patients or patients infected with microorganisms other than Pa at p < 0.05. (C) Fetuin and asialofetuin (1.0 µg) were processed for PNA lectin blotting (lanes 1, 2) as controls to validate PNA specificity. (D, E) Equal protein aliquots (100 µg) of BALF from noninfected patients or patients infected with microorganisms other than Pa (lanes 1–4), or Pa-infected patients (lanes 5–8) were (D) incubated with PNA-agarose and the PNA-binding proteins processed for MUC1-ED immunoblotting or (E) directly processed for MUC1-ED immunoblotting. MUC1-ED concentrations by ELISA are indicated under each lane in (E). Molecular weights in kDa are indicated on the right. Each arrow indicates the > 250 kDa MUC1-ED band of interest. PD, pull down; IB, immunoblot. The full-length immunoblot is shown. The results are representative of 2 independent experiments.

