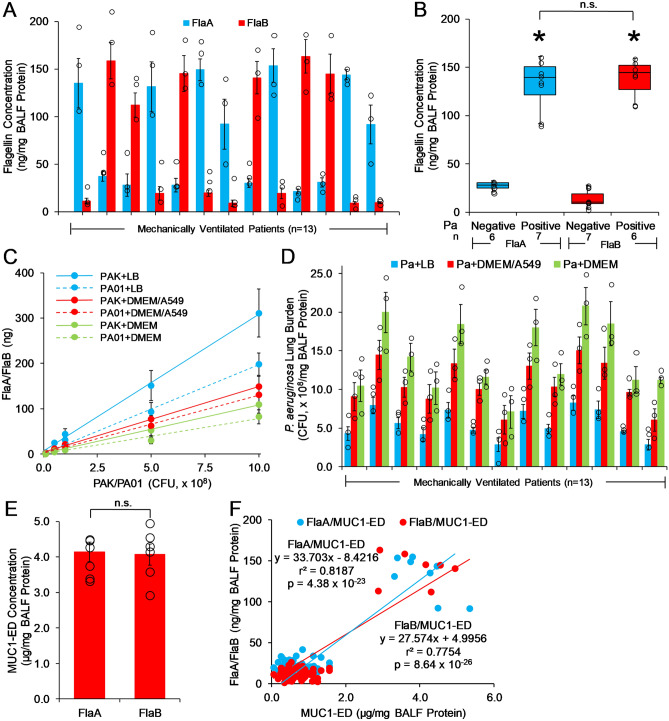
Figure 4.
Pa-derived flagellin is present in the BALF of Pa-infected VAP patients. (A) Pa FlaA and FlaB flagellin levels in BALF from Pa-infected patients (n = 13) were quantified by ELISA and normalized to total BALF protein. (B) Box and whisker plots of the data in (A). *, increased MUC1-ED levels compared with FlaA-negative or FlaB-negative BALF. n.s., not significant. (C) Increasing CFUs of FlaA-expressing PAK or FlaB-expressing PA01 bacteria were cultured in LB medium or DMEM containing 10% FBS in the presence or absence of A549 cells. The bacteria were lysed and the lysates processed for FlaA or FlaB levels by ELISA. Standard curves were calculated by linear regression. (D) Pa lung burden was calculated using the flagellin levels in (A) with interpolation from the standard curves in (C). Bars represent mean ± S.E. values (n = 3). Open circles represent individual values. (E) MUC1-ED levels in BALFs that cultured positive for FlaA-expressing Pa (n = 7) were compared with MUC1-ED levels in BALFs that cultured positive for FlaB-expressing Pa (n = 6). Bars represent mean ± S.E. MUC1-ED levels normalized total BALF protein. Open circles represent individual values. (F) BALF Pa FlaA and FlaB levels in (A) were correlated with BALF MUC1-ED levels (Fig. 2A) and analyzed by linear regression. The results are representative of 3 independent experiments.

