Figure 1.
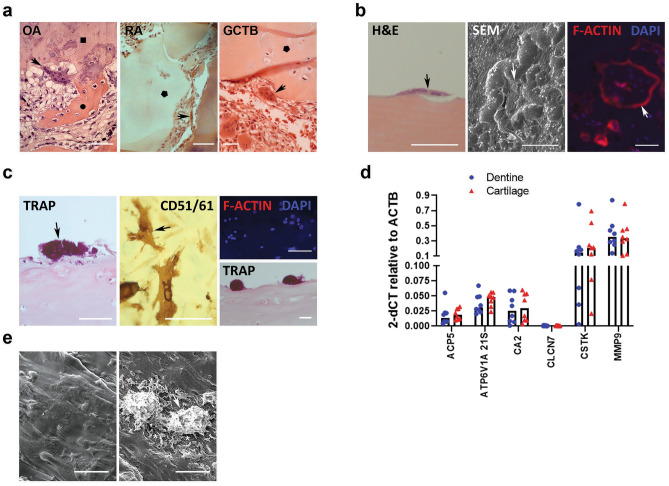
Osteoclasts visibly degrade cartilage matrix. (a) H&E staining of OA knee, RA and GCTB tissue. Multi-nucleated osteoclasts (arrow) resorb subchondral bone ( ) and invade mineralised (
 ) and unmineralised cartilage (
 ). (b) Osteoclasts (arrow) differentiated on dentine with (left) H&E-stained transverse section showing visible subcellular resorption, (middle) SEM image of a 97.49 µm diameter osteoclast surrounded by resorption tracks, and (right) F-actin rings (red) around multi-nucleated (blue) osteoclast. (c) Osteoclasts (arrow) differentiated on acellular cartilage showing (left, bottom right) TRAP-stained transverse section through multi-nucleated osteoclasts with no visible subcellular resorption and (middle) CD51/61-positive osteoclasts with (top right) no evidence of F-actin ring formation. (d) Expression of classical osteoclast marker genes by osteoclasts differentiated on dentine or acellular cartilage. ACP5 = TRAP, CLCN7 = H + /Cl − transporter channel 7), CTSK = cathepsin K (n = 8; multiple Mann–Whitney). (e) SEM images of (left) acellular cartilage and (right) osteoclasts (arrow) on acellular cartilage showing visible degradation the surrounding cartilage matrix (*). All scale bars = 100 μm.

