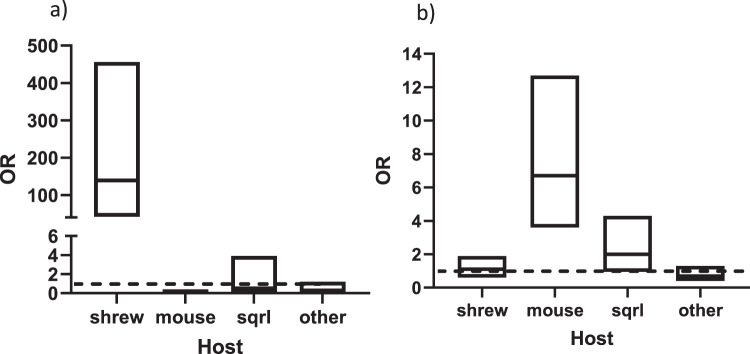
Fig. 4. The likelihood that an infected tick had fed on either a shrew, mouse, squirrel (or other Sciuridae), or other host.
The data for deer tick virus-infected ticks are shown in panel a, and the data for B. burgdorferi-infected ticks are shown in panel b. Data are represented by boxplots of odds ratios (OR) with 95% confidence intervals, and all field sites are combined (n = 20 deer tick virus-infected ticks, n = 128 B. burgdorferi-infected ticks). A line is drawn at OR = 1, and any confidence interval that crosses it is not statistically significant. Sqrl= squirrel (or other Sciuridae).

