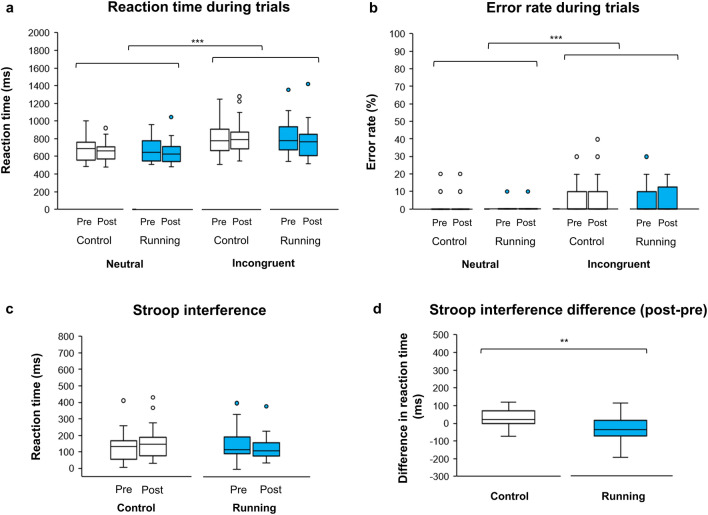
Figure 2.
Comparison of Stroop task performance in (a) reaction time and (b) error rate between neutral and incongruent conditions. (c) Difference in Stroop interference [incongruent—neutral] between control and running sessions. (d) Contrast in Stroop interference difference ([incongruent—neutral of post-session]—[incongruent—neutral of pre-session]) between control and running. The bottom, middle and top lines of each box indicate the 25th, 50th (median) and 75th percentiles, respectively. Whiskers above and below each box refer to the most extreme point within 1.5 times the interquartile range. Points above the whiskers are outliers. *** = p < 0.001, ** = p < 0.01.

