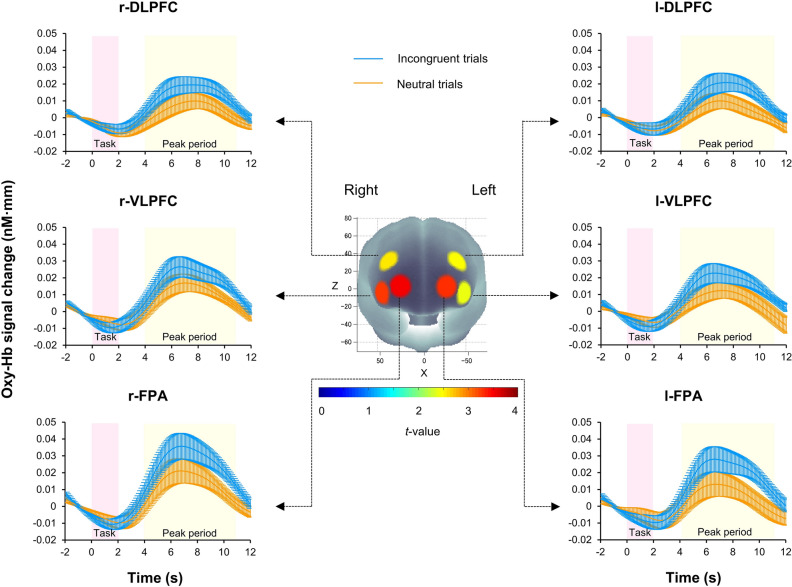
Figure 3.
Cortical activation patterns during performance of the color-word matching Stroop task (CWST) in the pre-session of control and running. Presented data are average values between the pre-session of control and the pre-session of running. Baseline (2 s before trial onset) is set at zero and peak periods are indicated from 4 to 11 s after trial onset. Significant Stroop-interference-related cortical activations [incongruent—neutral] were found in all regions of interest (ROIs) indicating that the Stroop interference effect can be observed. The t-map demonstrates oxygenated hemoglobin (Oxy-Hb) signal change, t-values are indicated as in the color bar. Data are mean ± SE.

