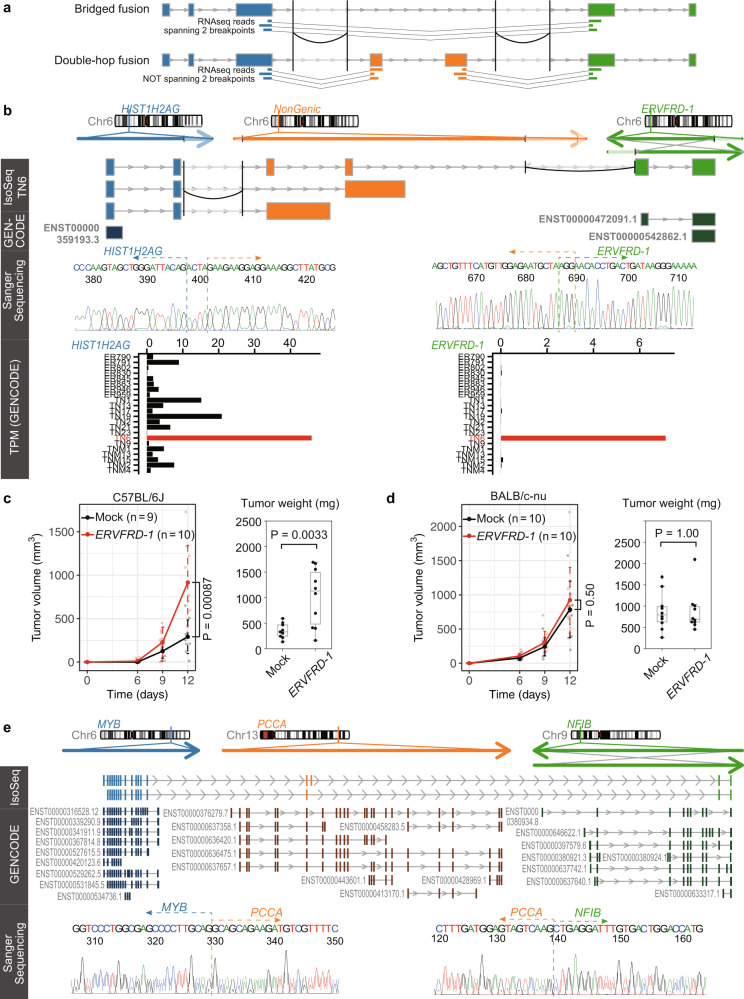
Fig. 6. Double-hop fusion.
a Schematic image of difference between bridged fusion transcript and double-hop fusion transcript. b Structure of double-hop fusion transcripts from HIST1H2AG–NonGenic–ERVFRD-1. The genomic axes represent three original genomic regions; below them are chimeric IsoSeq cluster reads. Curves correspond to structural variants detected with whole-genome sequencing data. The category “GENCODE” shows annotated transcripts. Outside regions of structural variants are shaded. To ensure visibility, exon–intron structures do not necessarily reflect accurate length. TPM denotes transcript per million. c, d Growth of MC38 tumor cells expressing ERVFRD-1 in C57BL/6J mice (c) and in BALBc/nu-nu mice (d). Error bars represent standard error. e Structure of double-hop fusion transcripts from MYB–PCCA–NFIB. Representative transcripts are shown for the GENCODE transcriptome.

