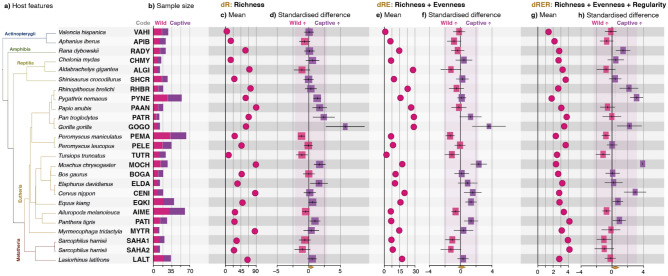
Figure 1.
Diversity differences of the gut microbiota between wild and captive vertebrate populations. (a) Phylogenetic tree, scientific names and dataset code of the analysed host species. (b) Number of wild and captive individuals. (c) Mean richness (number of genera) detected. (d) Mean standardised difference between the richness (dR) of wild and captive populations. Positive numbers indicate that the captive population is richer than the wild population and vice versa. (e) Mean effective number of taxa detected considering richness and eveness components (dRE). (f) Mean standardised difference between diversity dRE of wild and captive populations. (g) Mean effective number of lineages detected considering richness, eveness and regularity components (dRER). (h) Mean standardised difference between phylogenetic diversity dRER of wild and captive populations.

