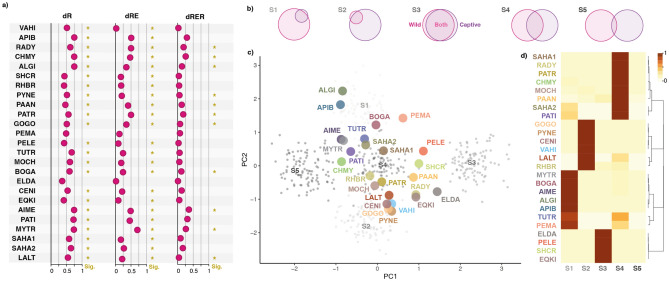
Figure 2.
Compositional differences of the gut microbiota between wild and captive vertebrate populations. (a) Compositional dissimilarity values between captive and wild populations for the different diversity metrics analysed. Stars indicate whether dissimilarities were significant according to the null models. (b) Visual representation of the five scenarios of microbiota variation. “S1” depicts the gut microbiota of captive animals as a subset of that of wild counterparts. “S2” describes the opposite scenario in which the gut microbiota of wild animals is a subset of that of captive counterparts. “S3” assumes barely no difference between the gut microbiota of both populations. “S4” defines a a situation in which captive animals recruit a proportional set of microorganisms that is different from that of wild counterparts, yet maintain a considerable overlap. “S5” describes a scenario in which the gut microbiotas of both populations are almost totally different. (c) Principal components analysis showing observed microbiota variation in the studied host species (large coloured dots) over simulated data points (small greyscale dots). (d) Histogram of posterior probabilities of the contrasted scenarios for each host species, sorted according to hierarchical clustering dendrogram. Abbreviations are explained in Fig. 1a.

