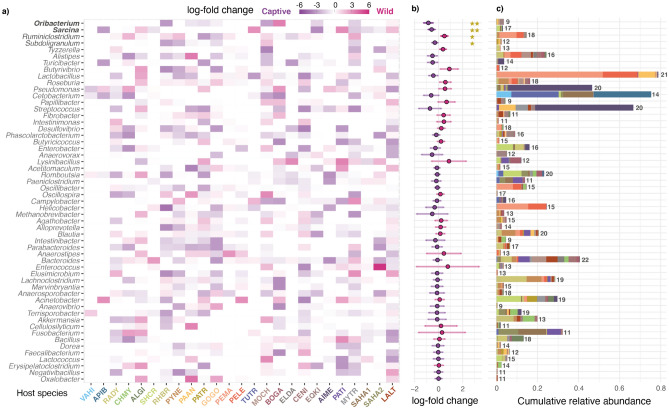
Figure 3.
Differential abundance of the microbial taxa with highest prevalence. The listed microbial taxa were detected in more than a 33% (9) of the studies. (a) Log-fold changes of the most prevalent taxa in each host species. Purple tones indicate enrichment towards captive conditions, while pink tones indicate enrichment towards wild conditions. (b) Log-fold change estimates and their standard errors derived from the random effects meta-analysis of microbial abundances. Two stars indicate p-values under 0.05, while a single star indicate p-values under 0.1. (c) Cumulative relative abundances of taxa across the analysed datasets. Each coloured box indicates the mean relative abundance value of the microbial taxa in each study. Numbers indicate number of host species in which each taxon was detected. Abbreviations are explained in Fig. 1a.

