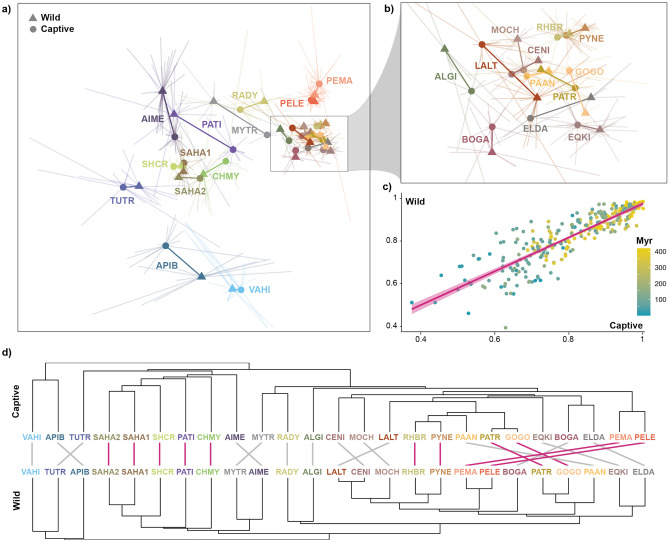
Figure 4.
Compositional differences of the gut microbiota between wild and captive animals. (a) NMDS plot of the gut microbiota composition between wild and captive animals coloured by host species. Triangles and circles linked by solid lines indicate the centroids of the gut microbiota composition in wild and captive animals, respectively, as defined by the individual data (outer edges of the thin lines) of each species. (b) Zoomed image of the NMDS plot to improve the visualisation of compositionally similar primates and artiodactylans. (c) Correlation plot between pairwise compositional differences of the gut microbiota between host species as calculated based on wild (Y axis) and captive (X axis) specimens. Colours of the dots indicate the evolutionary distance (in millions of years) between compared hosts. (d) Topological differences of the hierarchical clustering of species-level gut microbiota based on captive and wild animals. Common subtrees between captive and wild cladograms are highlighted by pink connecting lines. Abbreviations are explained in Fig. 1a.

