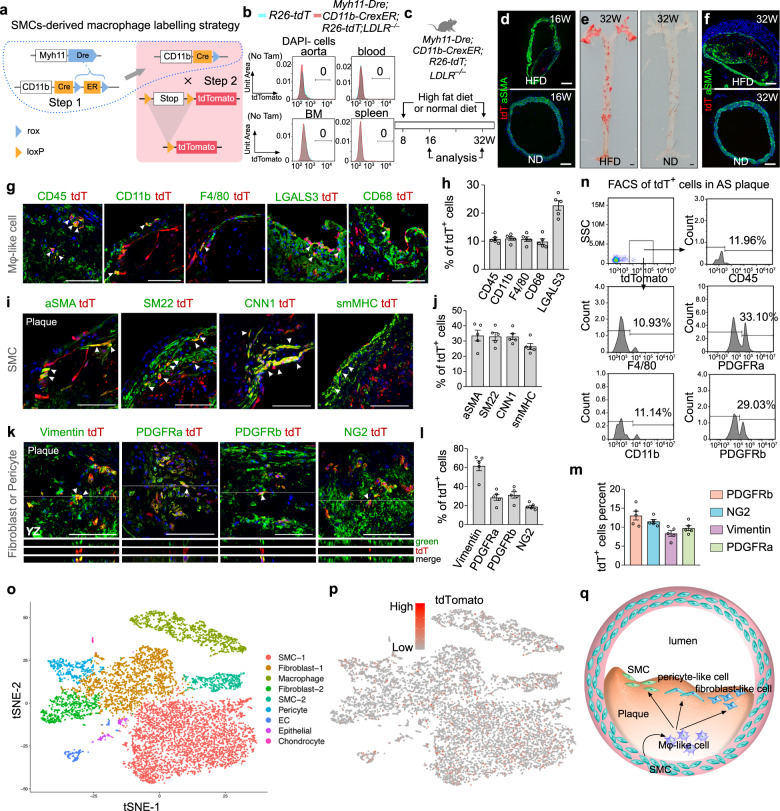
Fig. 1. Fate mapping of SMC-derived macrophage-like cells in advanced atherosclerotic plaques of 32-week-old mice.
a Schematic diagram showing the dual recombinase-mediated sequential intersectional genetic strategy. Step 1: Dre-rox recombination switches CD11b-CrexER to the CD11b-Cre genotype in smMHC+ cells; Step 2: when CD11b is activated, Cre-loxP recombination genetically labels CD11b-expressing cells. b Flow cytometric analysis of tdTomato+ cells in the blood, spleen, and bone marrow of Myh11-Dre;CD11b-CrexER;R26-tdT;LDLR−/− mice. c Schematic diagram showing the experimental strategy. Mice were treated with a high-fat diet (HFD) or normal laboratory diet. d Immunostaining for tdT and aSMA on aortic sections from 16-week-old mice treated with HFD or normal diet. e Whole-mount images of aortas after Sudan IV staining. f Immunostaining for tdTomato (tdT) and aSMA in aortic sections from mice treated with HFD or normal diet. g Immunostaining for tdT and CD45, CD11b, F4/80, LGALS3, or CD68 on plaque sections. Arrowheads, tdT+ macrophages. h Quantification of % of tdT+ cells expressing different macrophage markers in the plaques. Data are expressed as means ± SEM; n = 5. i Immunostaining for tdT and SMC markers. Arrowheads, tdT+ SMCs. j Quantification of the % of tdT+ cells expressing different SMC markers in the plaques. Data are expressed as means ± SEM; n = 5. k Immunostaining for tdT and fibroblast or pericyte markers. Arrowheads, tdT+ fibroblasts or pericytes. l Quantification of the % of tdT+ cells expressing fibroblast or pericyte markers in the plaques. Data are expressed as means ± SEM; n = 5. m Quantification of the % of fibroblasts or pericytes expressing tdT in the plaques. Data are expressed as means ± SEM; n = 5. n Flow cytometric analysis of different lineage markers expressed by tdT+ cells isolated from the plaques. o tSNE analysis of scRNA-seq data of 10,618 plaque cells from Myh11-Dre;CD11b-CrexER;R26-tdT;LDLR−/− mice fed with 24 weeks HFD. p Feature plot of tdTomato in different clusters. 1946 tdT+ cells are presented in the clusters. q Cartoon image showing a subset of SMC-derived macrophage-like cells adopting a transient cell fate and contributing to SMCs, pericyte-like cells, and fibroblast-like cells in the fibrous cap and atherosclerotic plaques. Scale bars: black, 1 mm; white, 100 µm. Each image is a representative of five individual biological samples.

