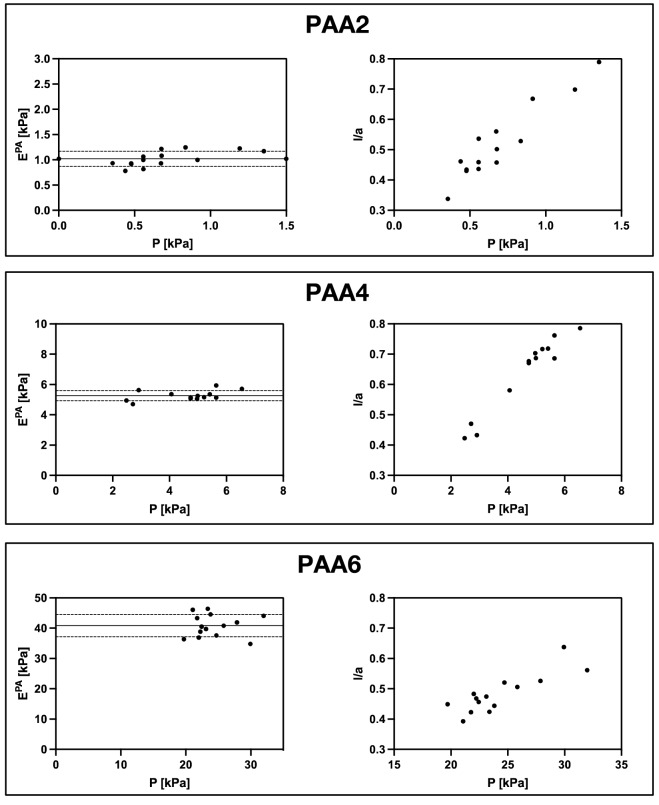
Figure 6.
Elastic moduli of different PAA hydrogels measured by pipette aspiration test performed for different pressures. Data for three hydrogels are reported as example, relative to low, medium and high stiffness. Measurable l/a values are mostly > 0.3, to avoid large reading errors. The graphs indicate that calculated moduli are substantially constant with applied pressure. The lines in the figure on the left represent the mean value of EPA and the standard deviation.

