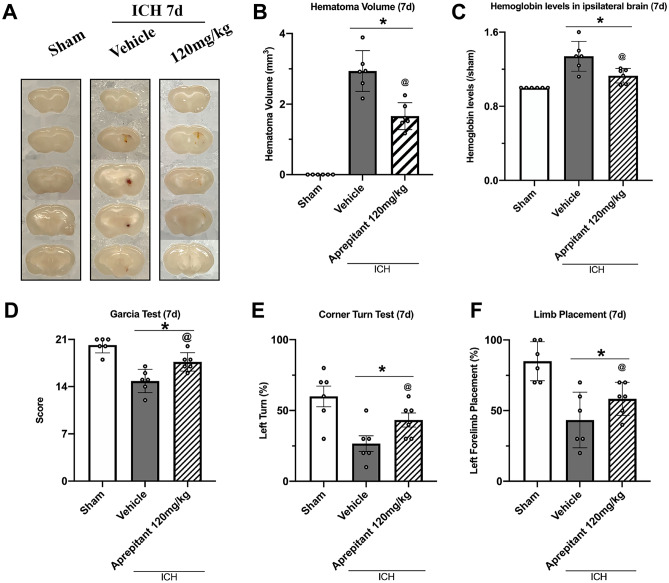
Fig. 4.
The effects of Aprepitant administration on hematoma volume, hemoglobin levels, and neurobehavior tests at 7 days post-ICH. A Representative photograph of brain sections, B–C quantitative analyses of hematoma volume and hemoglobin level, D Modified Garcia test, E corner turn test, and F forelimb placement test at 7 days after ICH. *p < 0.05 vs sham; @p < 0.05 vs ICH + vehicle. Error bars are represented as mean ± SD. One-way ANOVA, Tukey’s test, n = 6/group

