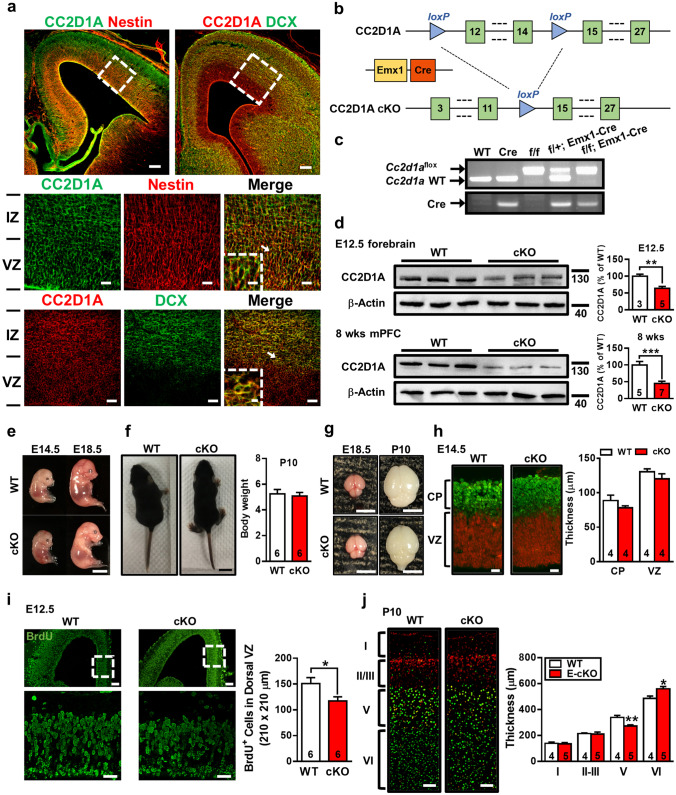
Fig. 1.
CC2D1A deficiency impairs development of cerebral cortex. a Representative double-immunofluorescence images show colocalization of CC2D1A (green) with the neural stem/progenitor cell marker nestin (left) or the immature neuron marker doublecortin (DCX; right) in the mouse brain at embryonic day (E)14.5. Middle and bottom panels are higher-power views of the boxed areas in the upper panels. Higher power views of arrowed areas are shown in the insets. Scale bars: top, 100 μm; middle, 20 μm (boxed area: 10 μm); bottom, 30 μm (boxed area: 5 μm). Images are representative of n = 4 mice. b Schematic representation of recombinant Cc2d1a construct; floxed allele enables Emx1-Cre mediated deletion of exon 12–14. c PCR screening of tail-derived genomic DNA for selection of wild-type (WT), Emx1-Cre, Cc2d1af/f, heterozygous (Cc2d1af/+; Emx1-Cre) and homozygous (Cc2d1af/f; Emx1-Cre) cKO mice. Images are representative of n = 4 mice for each genotype. d Western blot detection of CC2D1A protein levels in the forebrain at E14.5 (t(6) = 4.14, p = 0.006, WT, n = 3; cKO, n = 5; two-tailed unpaired Student’s t test) and the mPFC at 8 weeks old (t(10) = 4.74, p < 0.001, WT, n = 5; cKO, n = 7; two-tailed unpaired Student’s t test) of the indicated genotypes. e Representative photographs showing the body size of WT and cKO mice at E14.5 and E18.5. Scale bar, 5 mm. f Representative photographs and summary bar graph depicting the body weight of WT and cKO mice at postnatal day (P)10 (t(10) = 0.38, p = 0.71, n = 6 in each group; two-tailed unpaired Student’s t test). Scale bar, 1 cm. g Representative photographs showing the entire brain of WT and cKO mice at E18.5 and P10. Scale bar, 5 mm. h Representative double immunofluorescence staining for Ctip2 (green) and SOX2 (red) in cerebral cortices from WT and cKO mice at E14.5. Scale bar, 20 μm. Summary bar graph depicting the thickness of the cortical plate (CP; Ctip2+ neurons on the total of DAPI+ cells; t(6) = 1.23, p = 0.11, n = 4 in each group; two-tailed unpaired Student’s t test) and ventricular zone (VZ; SOX2+ neurons on the total of DAPI+ cells; t(6) = 1.23, p = 0.22, n = 4 in each group; two-tailed unpaired Student’s t test). i Representative images of BrdU labeling in cerebral cortices from WT and cKO mice at E12.5. Scale bars: top, 100 μm; bottom, 30 μm. Bottom panels are higher-power views of the boxed areas in the upper panels. Summary bar graph depicting the total number of proliferating (BrdU+) cells in the dorsal VZ of WT and cKO mice at E12.5 (t(10) = 2.379, p = 0.04, n = 6 in each group; two-tailed unpaired Student’s t test). j Representative double immunofluorescence staining for Ctip2 (layer V and VI marker; green) and Brn2 (layer II-III and V marker; red) in cerebral cortices from WT and cKO mice at P10. Scale bar, 100 μm. A significant change in the thickness of layer V (t(7) = 3.79, p = 0.006; two-tailed unpaired Student`s t test) and VI (t(7) = 2.91, p = 0.02; two-tailed unpaired Student’s t test) was observed in cKO mice (n = 5) compared with WT mice (n = 4). Data are represented as mean ± SEM. The total number of animal examined is indicated by n. *p < 0.05, **p < 0.01 compared with WT group

