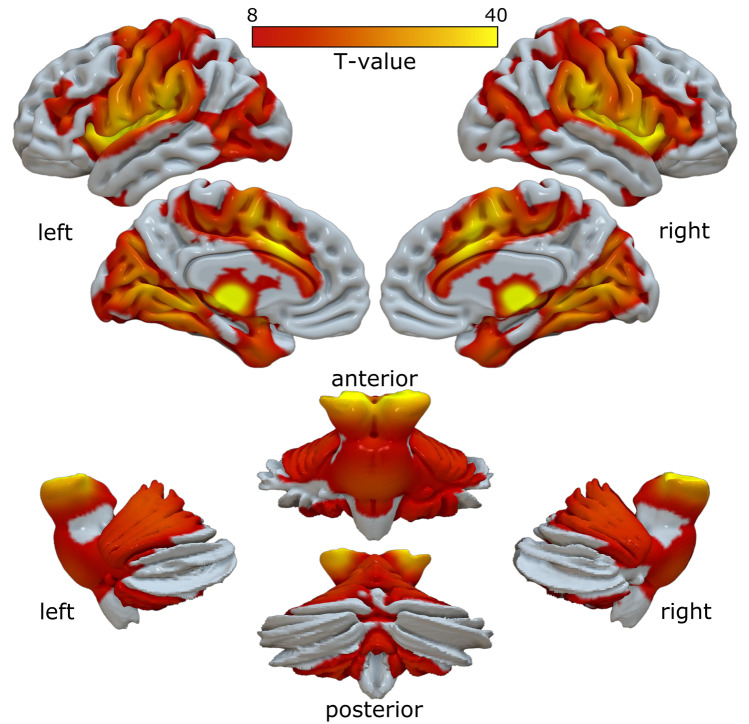
Fig. 5.
The CM-DBS-targeted functional network connectivity. Functional connectivity CM-DBS showed a very symmetric pattern across cerebral hemispheres that closely reproduced the structural connectivity pattern. The red to yellow color bar depicts the intensity of the connectivity from VTA to the rest of the brain. Specifically, the strongest connectivity appeared in the surrounding thalamic nuclei, followed by the brainstem and spreading to the cerebellum. Cortically, strong connectivity was detected in the anterior cingulate cortex, extending to the supplementary motor areas, the precentral and postcentral gyri, middle frontal cortex, and insula. Finally, connectivity was also depicted in the medial temporal and occipital cortices

