Fig. 5.
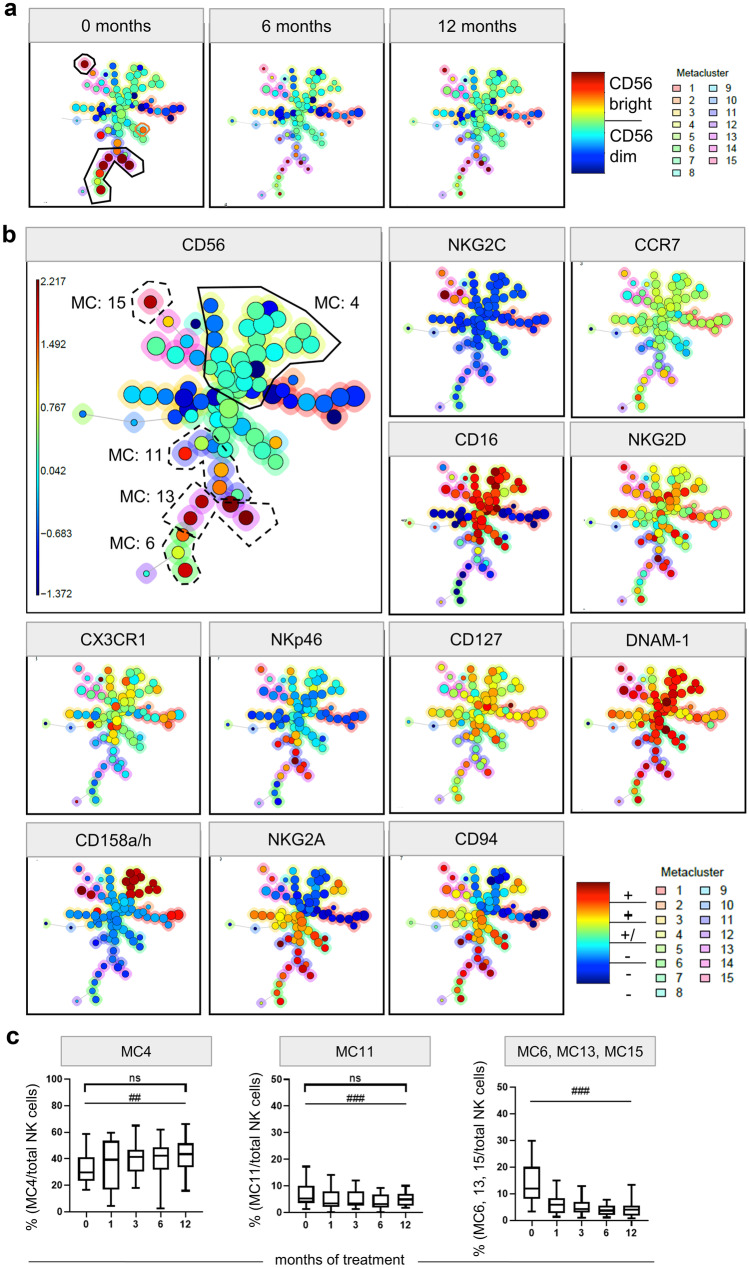
FlowSOM unsupervised clustering of CD56+ NK cells in fingolimod treated patients. The FlowSOM clustering was performed by analysing the expression of CCR7, NKG2C, DNAM-1, 158a/h, CD56, NKG2A, CD94, CD16, NKG2D, CX3CR1, NKp46, and CD127 on each cell for all samples. Cells with similar characteristics are merged into one cluster, shown as individual nodes in the minimum-spanning tree (MST). Clusters with similar conditions are pictured close to each other. The median fluorescence intensity of each marker is visualized by the colours; red represents high expression, while blue represents low marker expression. The colour around each cluster shows the MC this cluster belongs to. The cluster size represents the number of cells that integrates this cluster. a CD56 expression on NK cells at treatment start (0 months) and after 6 and 12 months of treatment. The CD56bright clusters are framed. CD56bright clusters decreased in size, while CD56dim cluster increased from treatment start to 6 and 12 months of treatment. b Expression of different markers. The MCs with significant changes are framed. The continuous line encloses the MC that increased, and the dashed line is around the MCs that decreased over the treatment period. c Box-and-whisker plot of the percentage of MC4 per total NK cells, MC11 per total NK cells, and the sum of MC6, 13 and 15 (all MC are CD56bright) per total NK cells of all included patients at treatment start (0 months) and 1, 3, 6, and 12 months after treatment. MANOVA *p ≤ 0.05; **p ≤ 0.01; ***p ≤ 0.001; exact Wilcoxon test #p ≤ 0.05; ##p ≤ 0.01; ###p ≤ 0.001; MC metacluster

