Figure 4.
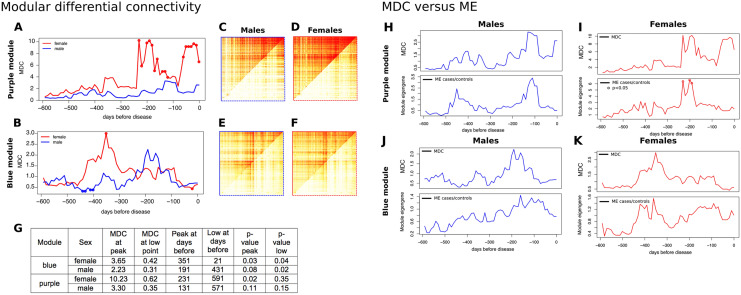
Dynamic changes in connectivity in the blue and purple modules. (A) and (B) module differential connectivity (MDC) over time in intervals of 10 days for the purple and blue modules, respectively. Solid points indicate a significant difference between cases and controls (FDR < 0.05). (C–F) Direct comparison of topological overlap matrix for cases (upper left triangle) and controls (lower right triangle) at the MDC peak time point. (G) MDC metrics. (H, I) Change in MDC in the purple module correlates with change in the module eigengene (ME). MDC and ME patterns were strikingly similar, except for the last time point before diagnosis in the purple module. The correlated patterns suggest that gene expression influences, MDC but is not the only factor. Solid points indicate a significant difference between cases and controls (P < 0.05). (J, K) Change in MDC in the blue module also correlates with change in ME.

