Fig. 2.
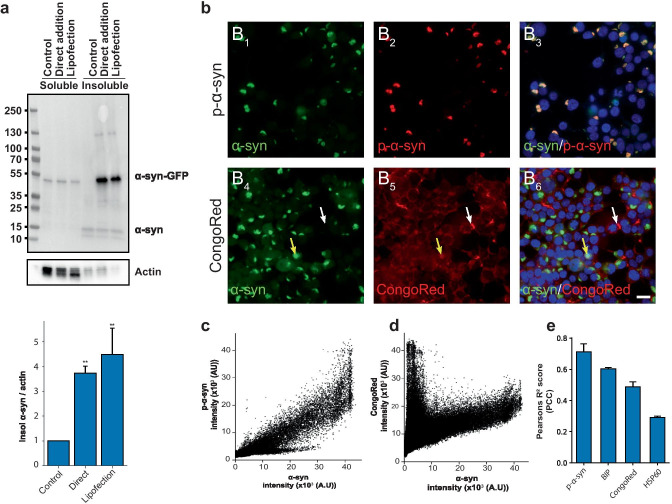
Induction of α-syn aggregation in NPR-H-001 cells recaptures key hallmarks of synucleinopathy. a Treatment of Hek293T α-synA53T-GFP with PFFs leads to a significant increase in phosphorylated α-syn compared to treatment with monomeric α-syn. Quantification of Western blot analysis showed levels of phosphorylated α-synuclein increased 3.7 (p < 0.009) and 4.4 (p < 0.003) folds with direct addition and lipofection, respectively, when compared to control treatment (n = 3). b α-Syn forms aggregates visible as compacted green inclusions, and colocalizes with phosphorylated α-synuclein as seen in B3. Staining with CongoRed reveals two populations of aggregates, double-positive for GFP and Congo red (B6 yellow arrow) and Congo red positive GFP negative (B6 white arrow) (scale bar 20 µm). c–d Correlation scatter plot between α-syn-GFP and p-α-syn c and Congo red d. e PCC (R2) for p-α-syn (0.71 ± 0.05), Congo red (0.48 ± 0.03), and the chaperone proteins BIP (0.60 ± 0.01) and HSP60 (R2 = 0.29 ± 0.008) (n = 3). Bar charts show mean ± SD, *p < 0.05, **p < 0.005, ***p < 0.001. Statistical testing was performed using one-way ANOVA with Dunnett’s T3 post hoc test for multiple comparisons to a control group, except e where comparisons between groups were not meaningful

