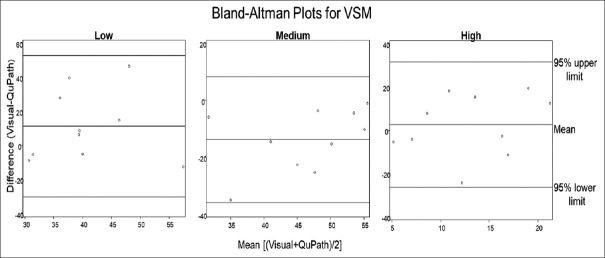
Figure 3.
Bland–Altman plots for vascular smooth muscle. Comparison of average of the difference and mean difference of staining intensity percentage between visual scoring and QuPath for vascular smooth muscle low, medium, and high staining categories. Comparison of scoring methods between low, medium, and high-intensity staining produced average differences and standard deviations of 1.23 (20.70), −13.79 (11.00), and 2.57 (14.45), respectively. All data points were within 2 standard deviations (95% confidence interval) of the mean

