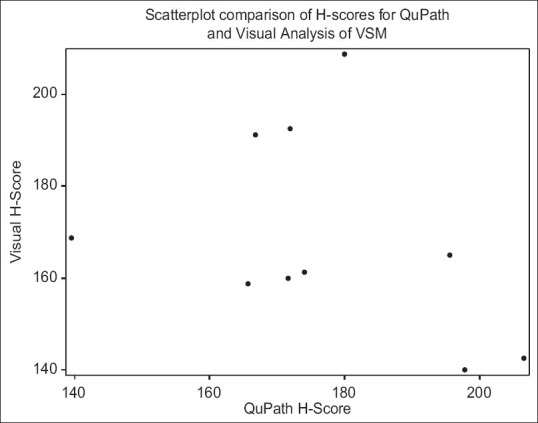
Figure 5.

Scatterplot comparison of H-scores for QuPath and visual analysis of vascular smooth muscle. The average H-score for each image by method is shown in this scatterplot. Spearman correlation was performed and revealed no statistically significant correlation between the H-score for the visual method and the H-score for the QuPath method (r = −0.33, P = 0.35)
