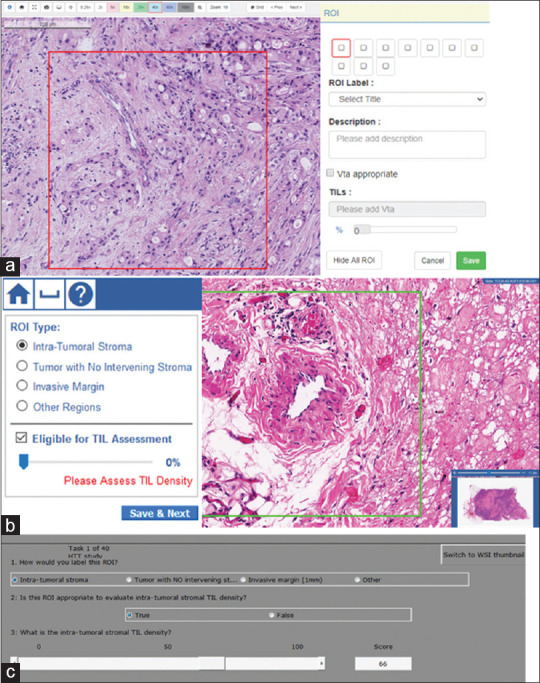
Figure 2.

Screenshots from graphical user interfaces of three platforms used in data collection. All three collect a descriptive label of the regions of interest [Table 1], a binary evaluation of whether the regions of interest are appropriate for stromal tumor-infiltrating lymphocyte density estimation, and an estimate of stromal tumor-infiltrating lymphocyte density via slider bar or keyboard entry. (a) PathPresenter and (b) caMicroscope are digital platforms. (c) Evaluation environment for digital and analog pathology microscope platform. In data collection, the pathologist is at the microscope, while a study coordinator records evaluations through the graphical user interface
