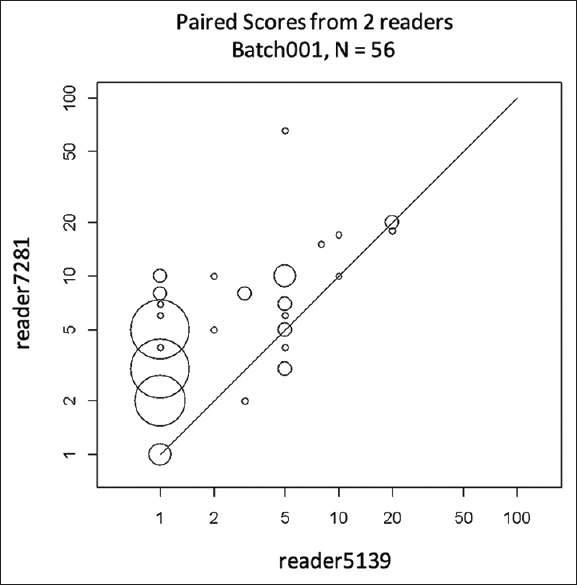
Figure 4.

Scatter plot of stromal tumor-infiltrating lymphocyte densities from two pathologists on eight slides (one batch) that led to 56 paired observations. The plot is scaled by a log-base-10 transformation (with zero stromal tumor-infiltrating lymphocyte values changed to ones). The size of the circles is proportional to the number of observations at that point
