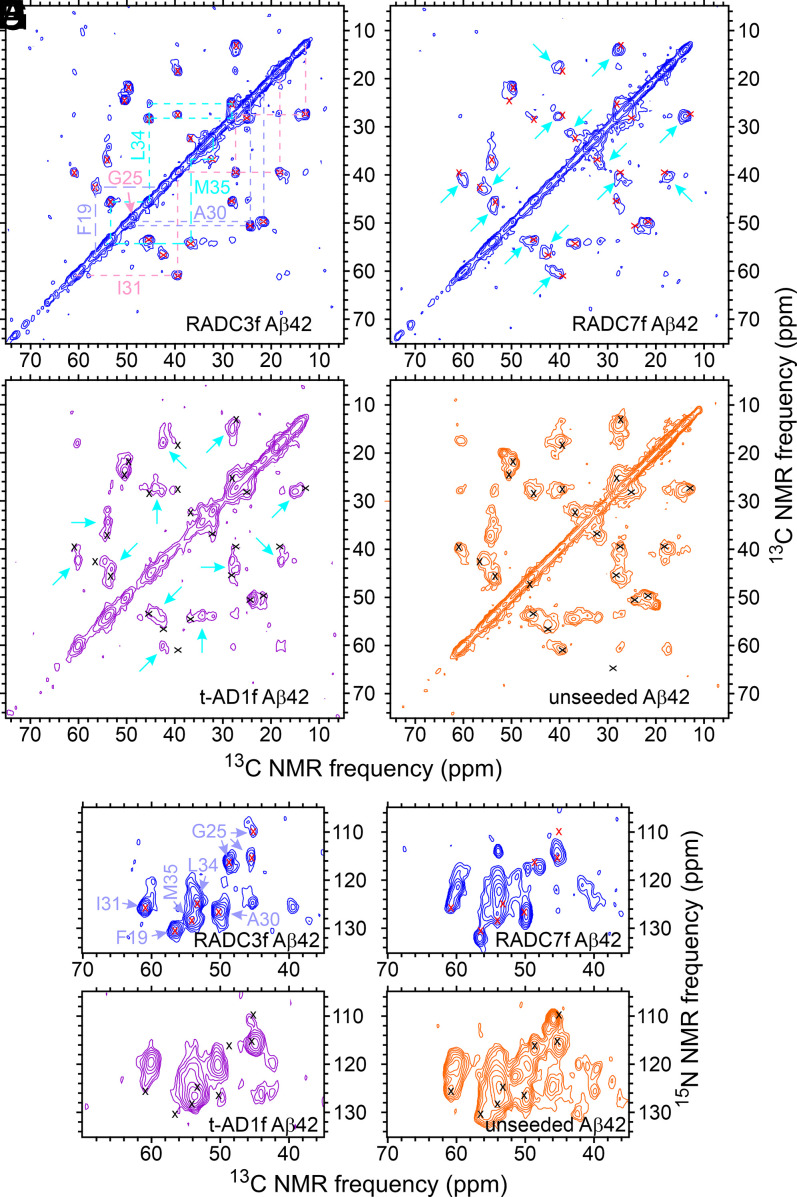
Fig. 3.
The 2D solid-state NMR spectra of brain-seeded Aβ42 fibrils with uniform 15N,13C-labeling of F19, G25, A30, I31, L34, and M35. (A–D) The 2D 13C-13C spectra of fibrils prepared from frontal lobe tissue of RADC subjects 3 and 7, fibrils prepared from frontal lobe tissue of AD patient t-AD1 [as reported previously by Qiang et al. (22)], and unseeded fibrils. Assignments of cross-peak signals to the labeled residues are indicated by cyan, pink, and pastel blue labels and dashed lines in A. Red and black X's in B–D indicate positions of cross-peak signals in A. Cyan arrows indicate additional cross-peak signals. Contour levels increase by successive factors of 2.0, with the lowest contour at ∼3.0 times the rms noise level in each spectrum. (E–H) The 2D 15N-13C spectra of the same fibrils, with similar annotations. Contour levels increase by successive factors of 1.5, with the lowest contour at ∼3.0 times the rms noise level. The full set of 2D spectra of Aβ42 fibrils prepared from RADC samples is given in SI Appendix, Figs. S6 and S7.

