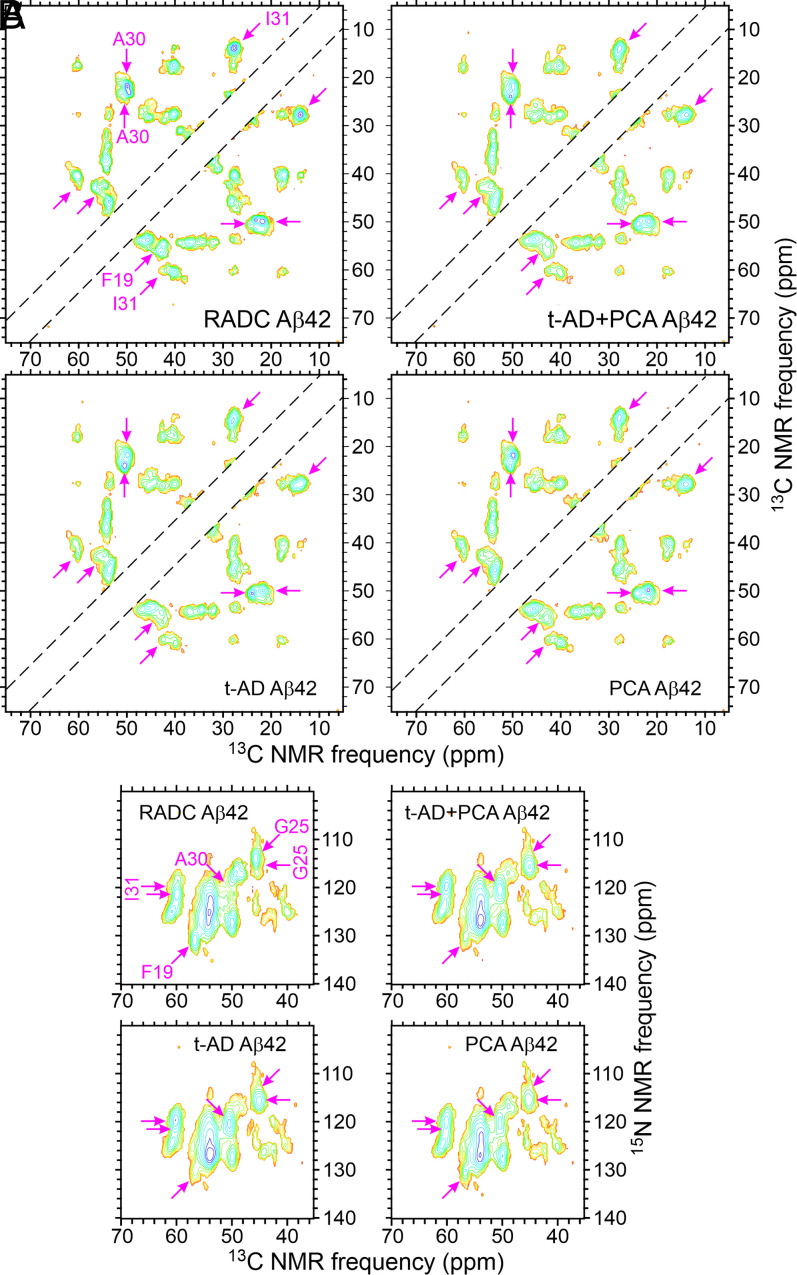
Fig. 7.
Average 2D spectra of isotopically labeled Aβ42 fibrils as in Fig. 6. The numbers of spectra used to calculate averages for RADC, t-AD + PCA, t-AD, and PCA-AD categories are 8, 14, 7, and 7, respectively, in A and 8, 11, 7, and 4, respectively, in B.

