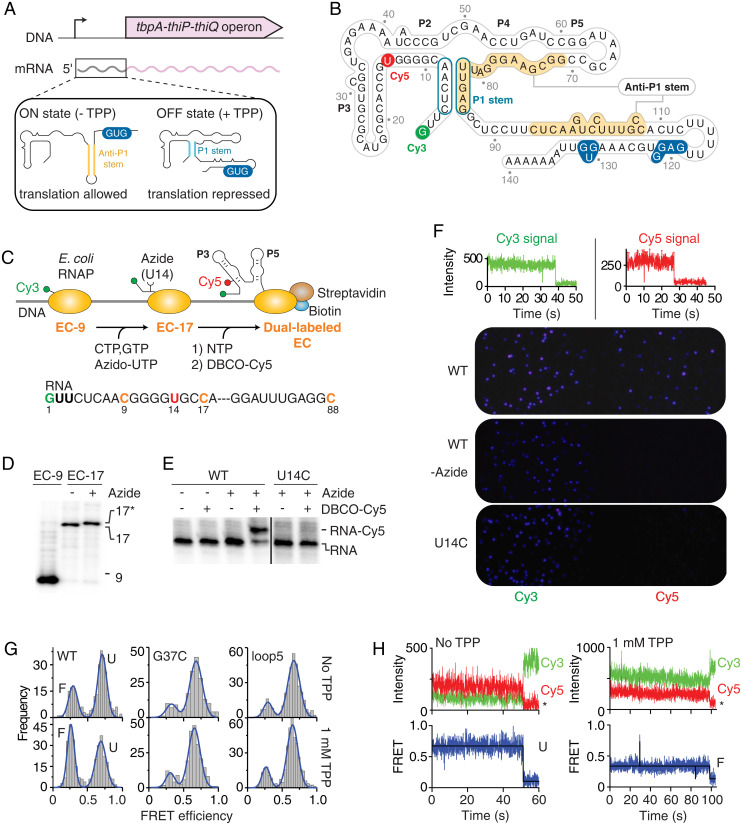
Fig. 1.
smFRET analysis of tbpA transcription ECs. (A) Genomic location of the tbpA riboswitch. The inset represents the ON and OFF states of the riboswitch and the formation of the anti-P1 and P1 stems, respectively. (B) Riboswitch secondary structure in the predicted TPP-bound OFF state. Cy3 and Cy5 dyes are indicated in green and red, respectively. The start codon and the RBS are indicated in blue. (C) Schematic approach to obtain Cy3-Cy5 dual-labeled ECs. The sequence of the RNA is shown below. (D) Polyacrylamide gel electrophoresis (PAGE) analysis of EC-9 and EC-17 transcripts. A gel retardation is observed for EC-17 with the azide-UTP (17*). (E) PAGE analysis of transcripts labeled with DBCO-Cy5 obtained with UTP (−) or azido-UTP (+). A gel retardation is observed for Cy5-labeled RNA species. (F, Top) Single-molecule traces of directly excited Cy3 and Cy5 show photobleaching in a single step. (Bottom) Single-molecule images of fluorescent ECs. While Cy5 fluorescent spots are observed when using wild-type EC (WT), no Cy5 signal is detected without the azido-UTP (-Azide) or using a U14C mutant (U14C). (G) smFRET histograms of nascent WT, G37C, and loop5 EC-88 in the absence or presence of 1 mM TPP. The folded (F) and unfolded (U) states are indicated for the WT. (H) smFRET time traces of EC-88 in the absence (Left) or presence (Right) of 1 mM TPP. The anti-correlated Cy3 donor and Cy5 acceptor emission intensities are shown with the resulting FRET trace. Photobleaching events are indicated by an asterisk.

