Fig. 3.
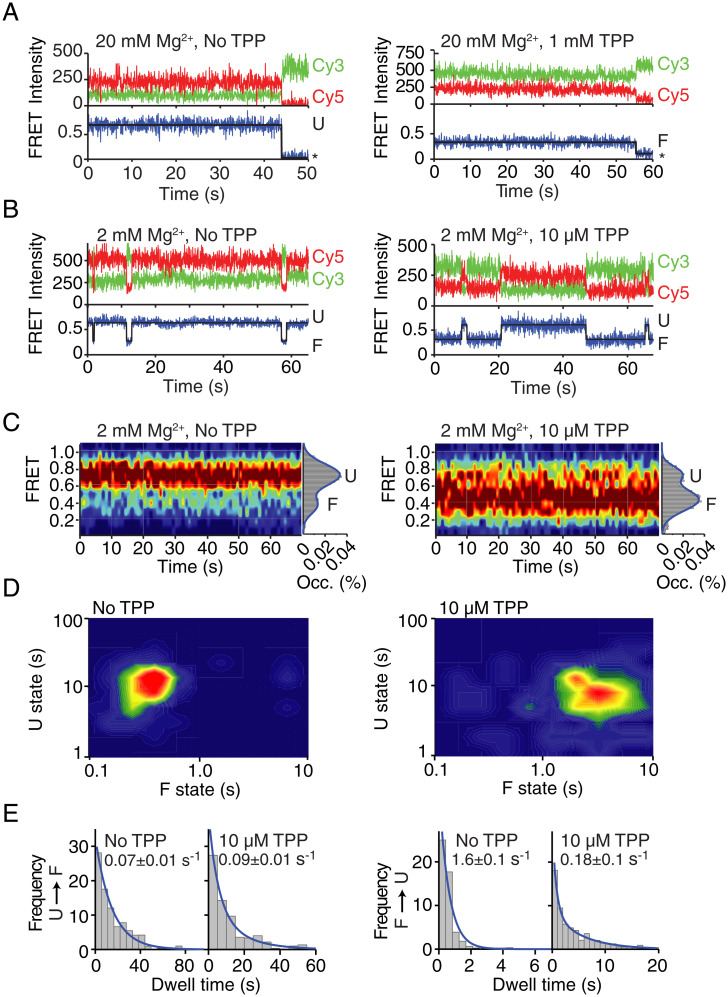
Structural dynamics of nascent transcripts in the context of EC-117. (A and B) Representative smFRET time traces of EC-117 at 20 mM Mg2+ (A) in the absence or presence of 1 mM TPP or at 2 mM Mg2+ (B) in the absence or presence of 10 µM TPP. The anti-correlated donor (Cy3, green) and acceptor (Cy5, red) emission intensities together with the resulting FRET trace are shown. (C) smFRET contour plots obtained at 2 mM Mg2+ in the absence or presence of 10 µM TPP. Values of 75 single traces were accumulated for the first 70 s. Histograms representing the percentual occupancy (Occ. %) of each state are shown to the right. (D) Two-dimensional contour plots of average dwell times for the U and F states at 2 mM Mg2+ in the absence or presence of 10 µM TPP. (E) Dwell time histograms of the U→F and F→U transitions at 2 mM Mg2+ in the absence or presence of 10 µM TPP. Exponential decay values are calculated for each condition.

