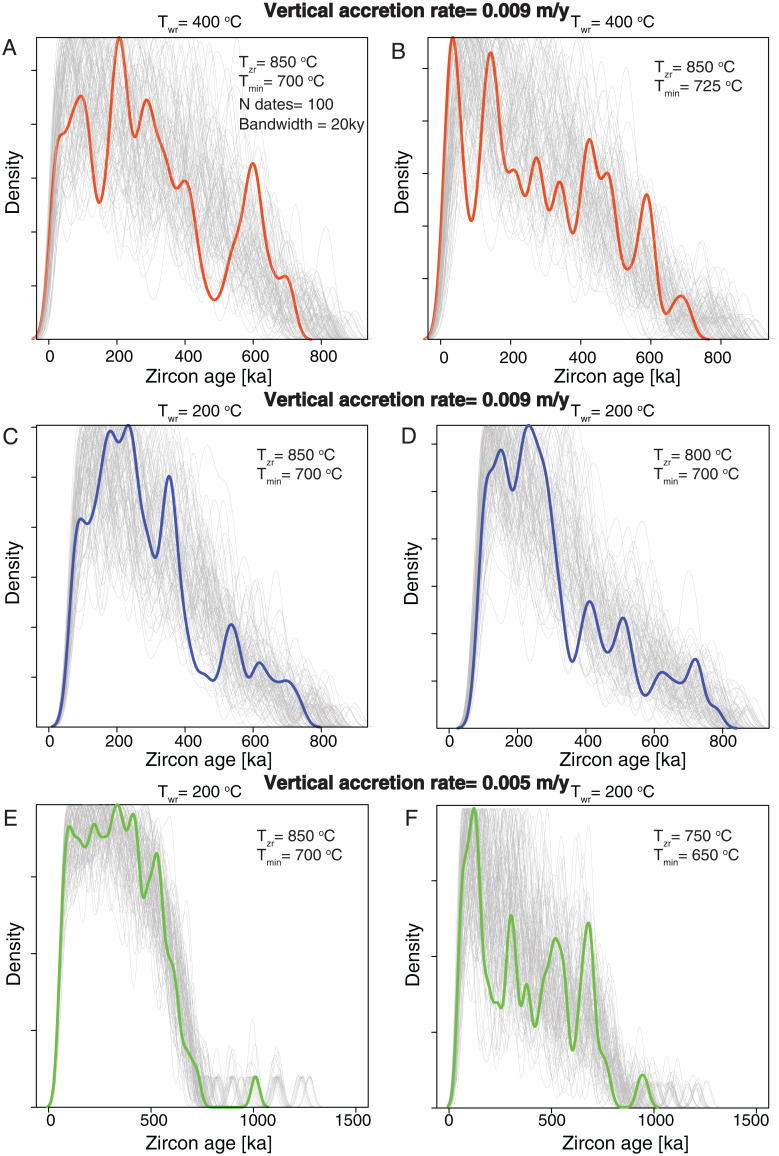
Fig. 2.
Distribution of zircon crystallization ages for different rates of magma input (VAR), temperature of the wall rocks (Twr), and temperature range of zircon saturation and eruption (Tzr, temperature of zircon saturation; Tmin, minimum temperature of eruption). (A–F) The gray lines are bootstrapped distributions obtained by subsampling the synthetic populations of zircon crystallization 100 times with a probability proportional to the number of calculated measurable crystallization times. The thick colored lines show an example of a distribution. Note the different scales of E and F. The peaks in crystallization times are randomly distributed and do not have a geological meaning.

