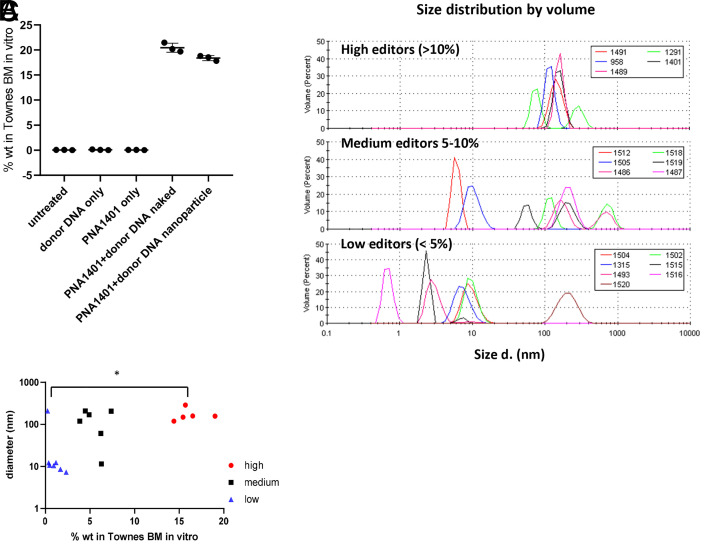
Fig. 5.
PNA and donor DNA form aggregates. (A) ddPCR signals from in vitro Townes BM when treated with donor DNA only, 1401 PNA only, a mixture of PNA and DNA, and PLGA NP formulated DNA/PNA with an untreated negative control for 3 d. (B) Plots of PNA/DNA aggregate size as measured by volume-weighted dynamic light scattering. The plots are separated for clarity into PNAs with average editing efficiency > 10% (Top), 5 to 10% (Middle), and <5% (Lower). (C) Dot plot of gene editing efficiency in BM as a function of mean PNA/DNA aggregate size. Horizontal bar indicates statistical comparison with equal variance by Student’s t test; *P < 0.05.

