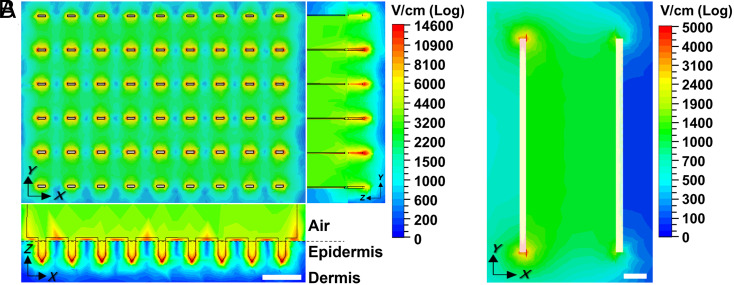
Fig. 3.
Electric field strength distribution in the skin determined by computer simulation. Peak electric field strength is shown when applying a 300-V pulse like those from the ePatch using an (A) MEA or (B) clamp electrode. Field strength distribution is shown in A from above the MEA (Upper Left) and as side views (Bottom Left and Right), and in B from above the skin. Dermal−epidermal junction is indicated by the dashed line. (Scale bar: 1 mm.)

